Select date

The Bubble That Could Break the World


by Jim Rickards, DailyReckoning:
 The key to bubble analysis is to look at what’s causing the bubble. If you get the hidden dynamics right, your ability to collect huge profits or avoid losses is greatly improved.
Based on data going back to the 1929 crash, this current bubble looks like a particular kind that can produce large, sudden losses for investors.
The market right now is especially susceptible to a sharp correction, or worse.
Before diving into the best way to play the current bubble dynamics to your advantage, let’s look at the evidence for whether a bubble exists in the first place…
My preferred metric is the Shiller Cyclically Adjusted PE Ratio or CAPE. This particular PE ratio was invented by Nobel Prize-winning economist Robert Shiller of Yale University.
CAPE has several design features that set it apart from the PE ratios touted on Wall Street. The first is that it uses a rolling ten-year earnings period. This smooths out fluctuations based on temporary psychological, geopolitical, and commodity-linked factors that should not bear on fundamental valuation.
The second feature is that it is backward-looking only. This eliminates the rosy scenario forward-looking earnings projections favored by Wall Street.
The third feature is that that relevant data is available back to 1870, which allows for robust historical comparisons.
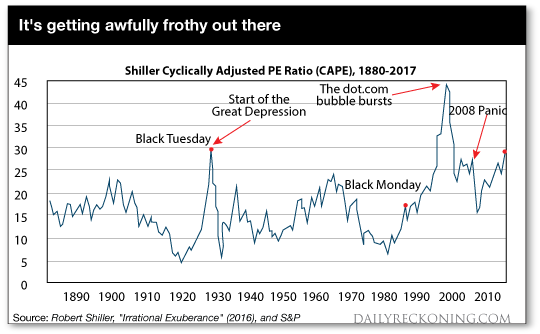
The chart below shows the CAPE from 1870 to 2017. Two conclusions emerge immediately. The CAPE today is at the same level as in 1929 just before the crash that started the Great Depression. The second is that the CAPE is higher today than it was just before the Panic of 2008.
Neither data point is definitive proof of a bubble. CAPE was much higher in 2000 when the dot.com bubble burst. Neither data point means that the market will crash tomorrow.
But today’s CAPE ratio is 182% of the median ratio of the past 137-years.
Given the mean-reverting nature of stock prices, the ratio is sending up storm warnings even if we cannot be sure exactly where and when the hurricane will come ashore.
With the likelihood of a bubble clear, we can now turn to bubble dynamics. The analysis begins with the fact that there are two distinct types of bubbles.
Some bubbles are driven by narrative, and others by cheap credit. Narrative bubbles and credit bubbles burst for different reasons at different times. The difference is critical in knowing what to look for when you time bubbles, and for understanding who gets hurt when they burst.
A narrative-driven bubble is based on a story, or new paradigm, that justifies abandoning traditional valuation metrics. The most famous case of a narrative bubble is the late 1960s, early 1970s “Nifty Fifty” list of fifty stocks that were considered high growth with nowhere to go but up.
The Nifty Fifty were often referred to as “one decision” stocks because you would just buy them and never sell. No further thought was required. Of course, the Nifty Fifty crashed with the overall market in 1974 and remained in an eight-year bear market until a new bull market began in 1982.
The dot.com bubble of the late 1990s is another famous example of a narrative bubble. Investors bid up stock prices without regard to earnings, PE ratios, profits, discounted cash flow or healthy balance sheets.
All that mattered were “eyeballs,” “clicks,” and other superficial internet metrics. The dot.com bubble crashed and burned in 2000. The NASDAQ fell from over 5,000 to around 2,000, then took sixteen years to regain that lost ground before recently making new highs. Of course, many dot.com companies did not recover their bubble valuations because they went bankrupt, never to be heard from again.
The credit-driven bubble has a different dynamic than a narrative-bubble. If professional investors and brokers can borrow money at 3%, invest in stocks earning 5%, and leverage 3-to-1, they can earn 6% returns on equity plus healthy capital gains that can boost the total return to 10% or higher. Even greater returns are possible using off-balance sheet derivatives.


