Select date

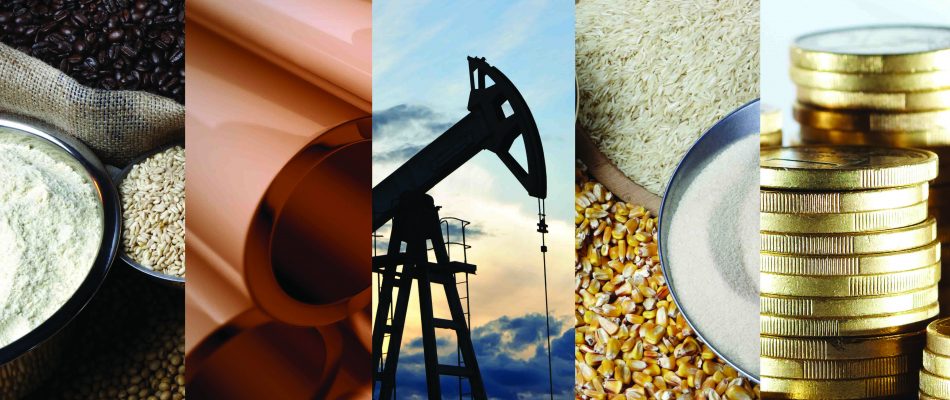
The Chart 45 Years in the Making – Commodities vs S&P500


by Marin Katusa, Katusa Research:
 Dear Katusa Reader,
Commodities relative to the S&P 500 have NEVER been cheaper.
The chart below I created is a ratio of the S&P Commodity index vs the S&P 500 over 47 years.
What is the main take away from this chart?
You can quickly assess that, relatively speaking, commodities are dirt cheap. In fact, they are the cheapest they have ever been to the share prices that make up the S&P 500.
So, how can we make money from this chart?

First, I would recommend those fund managers and investors who own shares in the companies that make up the S&P 500 not to be margined and start taking profits to lock in their gains. The big board looks ripe for a correction.
Secondly, raise your cash position.
The bargains in the commodity sector are starting to present themselves, and many of the best resource companies are at incredible valuations.
But keep in mind that successful investing is a marathon, not a sprint. I’ll remain patient and wait for great entry prices.
As I detail in my book, Resource Market Millionaire “small cap resource stocks are among the most volatile stocks in the world. One-day moves of 10%…15%…and 20% are common in small resource stocks.”
One day, the share price of a good company will be $1.50. The next day, it will be down 20% to $1.20.
While that volatility turns many people off, we can turn it into a huge edge for us.
We can do so by “stalking” our stocks. We need to remain patient…like a lion that waits and waits for just the right moment to strike.
When I find a great opportunity, I don’t run into the market and buy at any price. Instead, I stay patient and wait for great prices. I “stalk” the stock. I wait for the market to mark down the merchandise I want to buy.
And if it takes me weeks to accumulate the amount of shares I want at the price I want, so be it. That’s just how the resource market works. It’s how I’ve operated in the market for years and years.
For example, back in the November issue of Katusa’s Resource Opportunities titled “Get Ready to Buy: Bargain Season is Coming”, I recommended a company called Kirkland Lake Gold.
One of the reasons I loved the company was because at the time it had an enterprise value per ounce of gold produced much lower than its peer group. The chart below shows the Enterprise Value (Market Cap + Debt – Cash) compared to its peer group. Kirkland Lake on that one metric was the cheapest in its group.

This was just one of many comparables I published in the report. Another comparable I used was the company’s cash flow per share compared to its peer group. The chart below shows the Price to cash flow of the intermediate gold producers from 2016.

At the time of publication, the stock was trading at CAD$8.29.
But I was not comfortable buying at those prices. I wanted to buy it like an alligator under CAD$7.00. And that’s the guidance I wrote to my subscribers…
There is no need to rush out and buy a full position and wait for the repricing back to the peer group. This will take alligator-like patience. Accumulate stock slowly and always buy on weakness; do not overpay for the stock.

