Select date

San Francisco Bay Area Sheds Jobs and Workers


by Wolf Richter, Wolf Street:
![]() Commercial and residential real estate bubbles choke the economy. The upper bounds of hype and craziness have been reached.
Commercial and residential real estate bubbles choke the economy. The upper bounds of hype and craziness have been reached.
The San Francisco Bay Area has seen an astounding jobs boom since the Great Recession. The tsunami of global liquidity that washed over it after the Great Recession, central-bank QE and zero-interest-rate policies that sent investors chasing blindly after risk, a blistering no-holds-barred startup bubble with the craziest valuations, one of the greatest stock market bubbles ever – whatever caused the boom, it created one of the craziest housing bubbles ever, a restaurant scene to dream of, traffic jams to have nightmares over, and hundreds of thousands of jobs. But it’s over.
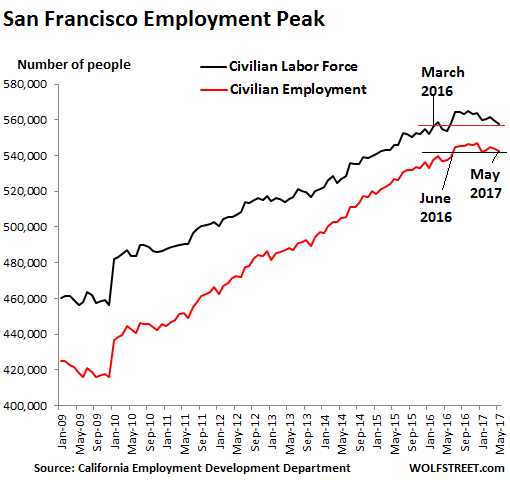
In May, employment in San Francisco dropped to 542,600 jobs, the lowest since June 2016, according to the data released on Friday by the California Employment Development Department. The employment peak was in December 2016 at 547,200.
The labor force in the City fell to 557,600. That’s below March 2016! This confirms a slew of other data and anecdotal evidence: People and businesses are leaving. It’s too expensive. They’re voting with their feet.
The blue line in the chart below shows the decline in the labor force (the number of people who live in San Francisco and are deemed to be in the labor force). The red line shows employment (the number of people working in the City regardless of where they live, including the many who commute from other areas):
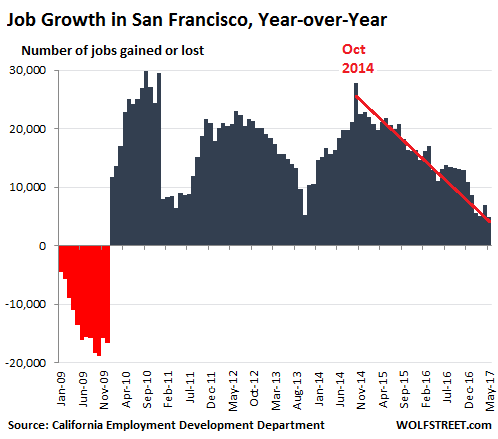
The year-over-year increase in May of 4,900 jobs in San Francisco was the lowest year-over-year increase since the plunge during the Great Recession.
Between December 2009 (the low point during the Great Recession) and December 2016 (the high point since then), the City created 131,400 jobs. An increase of 31.6% in seven years! The city created on average 18,800 jobs per year over the period, a breath-taking employment boom for a city of 850,000 people. And San Francisco accounts for only 11% of the Bay Area population of 7.68 million.
This chart shows the year-over-year employment gains (blue) and losses (red) since January 2009. Note the trend from the job creation peak in the fall of 2014:
Across the Bay, in Alameda County, whose population is about twice the size of San Francisco’s, and which includes Oakland, Berkeley, and other cities, a similar scenario is playing out.
