Select date

Bubble Update: Stocks Are Now at 1999 Bubble Levels (Guess What’s Next)


by Graham Summers, Market Oracle:
 Remember the 2007 Bubble?
Remember how everyone said that it really wasn’t that big of a bubble because stocks weren’t as expensive as they had been during the previous bubble (the Tech Bubble).
We all remember how that turned out: the bubble burst leading to the greatest financial crisis in 80 years.
Well, today’s bubble is WAY larger than that of 2007. And arguing that stocks are cheaper than they were during the Tech Bubble doesn’t hold water anymore either.
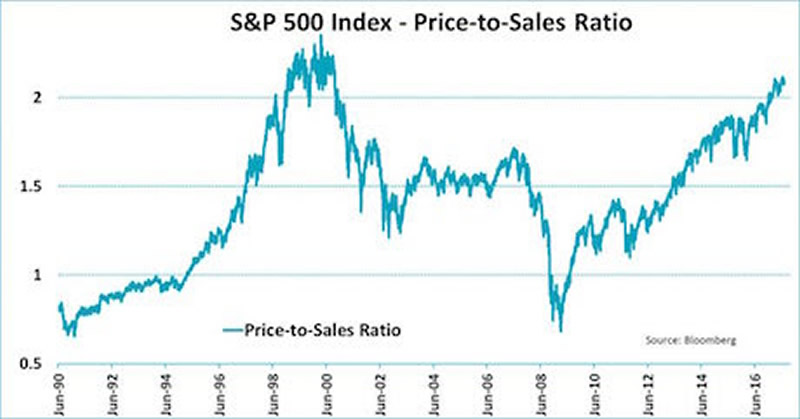
Below is a chart showing the S&P 500’s Price to Sales ratio (also called the P/S ratio). As you can see, based on this metric, the 2007 Bubble is a mere blip. We’re now in territory not seen since the 1999-2000 Bubble.
H/T Jeroen Blokland
Why does this matter?
Earnings, cash flow, and book value are all financial data points that can be massaged via a variety of gimmicks. As a result of this, valuing stocks based on Price to Earnings, Price to Cash Flow, and Price to Book Value can often lead to inaccurate valuations.
Sales on the other hand are all but impossible to gimmick. Either money came in the door, or it didn’t And, if a company is caught faking its sales numbers, someone is going to jail.
So the fact that stocks are now trading at a P/S ratio that matches the Tech Bubble (the single largest stock bubble in history) tells us that we’re truly trading at astronomical levels: levels associated with staggering levels of excess.
What does that mean for stocks?
We’re going to have the 3rd and worst crisis in 20 years.
A Crash is coming…
And smart investors will use it to make literal fortunes.


