Select date

Understanding Time & the Kondratieff Wave


by Martin Armstrong, Armstrong Economics:
 QUESTION: Dear Martin,
I am an reader of your blog and attendee of some of your conferences. I am quite impressed about the timing of your forecasting arrays. In particular, May 1 you published the arrays for DJIA (attached) where you showed two clusters of volatility: the weeks of 15 May and 26 June. I was really stupefied when I witnessed two vicious drops in XIV (an ETF replicating the inverse of 60 days expected implied volatility of S&P500) precisely in the weeks you indicated. The best model academia has come up with for modelling volatility is a Stochastic Volatility Model with Jumps, where returns of the underlying (index) are random, their volatility is random (mean reverting though) and infrequent jumps also occur randomly. In fewer words forecasting volatility is just impossible for academics, but not for you.
Do you see any more clusters coming in the summer? Are you going to give access to forecasting arrays through ask-Socrates soon?
Best regards.
![]()
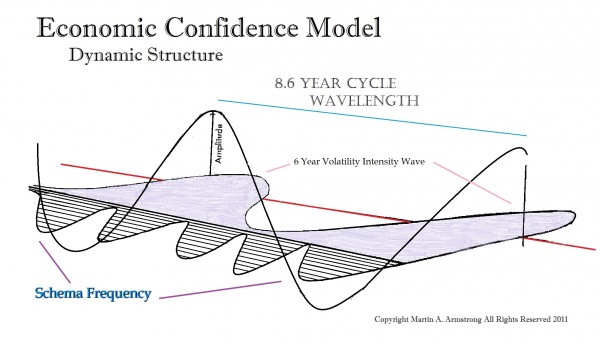
ANSWER: Academics try to create models about things they do not comprehend. Volatility comes in different flavors and stochastic is an interesting confirming tool, but never a forecasting tool. Volatility is interlinked with TIME, but it is simply deeply hidden within this complex fourth dimension.

You cannot forecast volatility in any of its flavors without interfacing TIME in every other aspect of this dimension. Creating flat models like a stochastic take one aspect of a market and then attempts to extrapolate the future based upon this single tool only to fail. We have a stochastic model you can plot and the interesting thing is it is never consistent since sometimes it’s peaking in advance to a turn and at other times after the turn. They never forecast a flash crash or anything on that nature. This Fourth Dimension is extremely complex. Far beyond any one dimensional model can map.
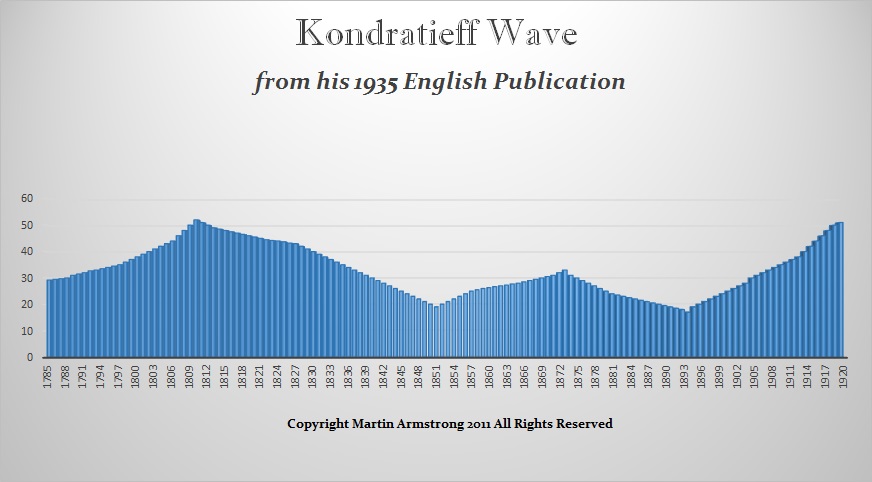
Even those claiming to be using the K-Wave cannot make real forecasts. The basis of Kondratieff’s argument came from his empirical study of the economy’s performance of the USA, England, France, and Germany between 1790 and 1920. Kondratieff took the wholesale price levels, interest rates, production and consumption of coal, pig iron, and lead for each economy. He then sought to smooth the data using an averaging mathematical approach of nine years to eliminate the trend as well as shorter waves. Kondratieff thus arrived at his long-wave theory suggesting that the economic process was a process of continuous waves of boom and bust.
The problem with his data was that it properly reflected the beginning of his study. But as the Industrial Revolution took place, agriculture, which was 70% of the economy in 1850, fell to 40% by 1900 and eventually to 3% by 1980. His model failed because there was a cycle to the economy as well which he did not take into account. We moves from a commodity based system, to industrial, and now to primarily service. As we move further down this road, we can see that economic growth has declined for government has growth too big and is now consuming 40% of GDP compared to less than 10% at the beginning of his work. Then we now have the internet displacing jobs in stores (service industry) just as the invention of automobiles displaced the horse and buggy. There is a cycle to change as well and this is absent from the K-Wave.
