Select date

What’ll Happen to US Commercial Real Estate as Chinese Money Dries Up?


by Wolf Richter, Wolf Street:
![]() See Manhattan.
See Manhattan.
In the second quarter in Manhattan, Chinese entities accounted for half of the commercial real estate purchases with prices over $10 million. By comparison, in 2011 through 2014, total cross-border purchases from all over the world (not just from China) were in the mid-20% range.
“At a time when domestic investors have pulled back, foreign parties have ramped up their holdings in Manhattan,” according to Avison Young’s Second Quarter Manhattan Market Report.
This includes the $2.2 billion purchase in May of 245 Park Avenue by the Chinese conglomerate HNA Group, the sixth largest transaction ever in Manhattan. And at $1,282 per square foot, it was “among the highest price per pound for this type of asset.”
The purchase of the 45-story trophy tower is being funded in part by money borrowed in the US via a $508 million loan from JPMorgan Chase, Natixis, Deutsche Bank, Barclays, and Societe Generale, according to CommercialCafé. The rest is funded by HNA’s other sources, presumably in China.
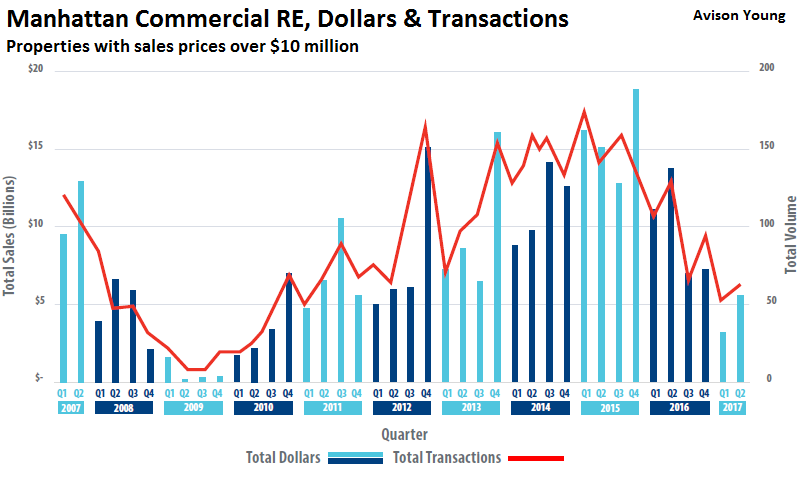
The influx of Chinese money and the propensity by Chinese companies to hunt down trophy assets have propped up prices in Manhattan. And yet, despite the Chinese hunger, total sales volume has plunged, according to Avison Young:
At the end of the first half of 2017, the annualized forecast of total transaction volume was on pace to be 40% lower than 2016, and a 60% drop-off from 2015. At the current pace, 2017 is shaping up to have the lowest sales count since the period from 2008 to 2010, the last market trough.
Dollar volumes tell a similar story at the year’s halfway mark. The first quarter’s $3.2 billion in dollar transactions was improved to $5.6 billion in the second quarter, but this increase was largely attributable to a single $2.2 billion purchase while the first quarter lacked any billion dollar transactions.
From the third quarter of 2013 through the second quarter of 2016, the Manhattan market averaged 141 transactions per quarter and never recorded less than 112 in that 12-quarter span. In the trailing four quarters ending 2Q 2017, the average transaction count dropped to 71, with the most recent tally [in Q2] at 66 for this second quarter.
This chart by Avison Young shows the peak in 2015 and the plunge since (click to enlarge):
That’s the gloomy data on investment activity. Office leasing activity, the underpinning of the office market, isn’t exactly booming either. According to Avison Young’s report, office leasing volume in the second quarter plunged 32% year-over-year to 5.0 million square feet.


 money")