Select date

May 2024
Mon Tue Wed Thu Fri Sat Sun

World Bank on Philippines Economy

2-2-2018 < Global Research 183 3329 words


  • The Philippines is one of the most dynamic economies in the East Asia and the Pacific region. NONSENSE, THE RESULT OF IMPORT LED GROWTH, REMITTANCES FROM OVERSEAS


    With increasing urbanization, a growing middle-income class, and a large and young population, the Philippines’ economic dynamism is rooted in strong consumer demand supported by improving real incomes and robust remittances. Business activities are buoyant with notable performance in the services sector including the Business Process Outsourcing, real estate, and finance and insurance industries. GROWTH OF AREAS OF THE ECONOMY MARKED BY CORRUPTION AND SPECULATION, 


    Sound economic fundamentals and a globally recognized competitive workforce reinforce the growth momentum. LOW WAGES


    Having sustained an average annual growth of 6.3 percent between 2010-2016 from an average of 4.5 percent between 2000-2009, the country is poised to make the leap from a lower-middle income country with a gross national income per capita of US$3,580 in 2016 to an upper-middle income country status (per capita income range of US$3,956 – 12,235) in the medium term. NONSENSE BASED ON GDP ARITHMETICS,


    The Philippines remained a consistent growth performer in the East Asia region, although growth moderated in the first half of 2017. OVERSEAS REMITTANCES


    The Philippines grew in the first half of 2017 faster than Indonesia, Thailand, Malaysia and Vietnam, but slower than China. Following strong growth in the immediate months after the new administration assumed office in July 2016, the economy had a slow start in the first half of 2017. The GDP growth rate was 6.4 percent, year-on-year, in the first half of 2017, compared to 7.0 and 6.8 percent in the first and second half of 2016, respectively. Private consumption resumed its position as the main engine of economic growth, and a rebound in exports contributed to growth.


    The rapidly growing domestic economy has yielded substantial gains in poverty reduction. NONSENSE, THE DEFINITION OF POVERTY FRONTIER SET BY WORLD BANK ADOPTED BY PHILIPPINES GOVERNMENT


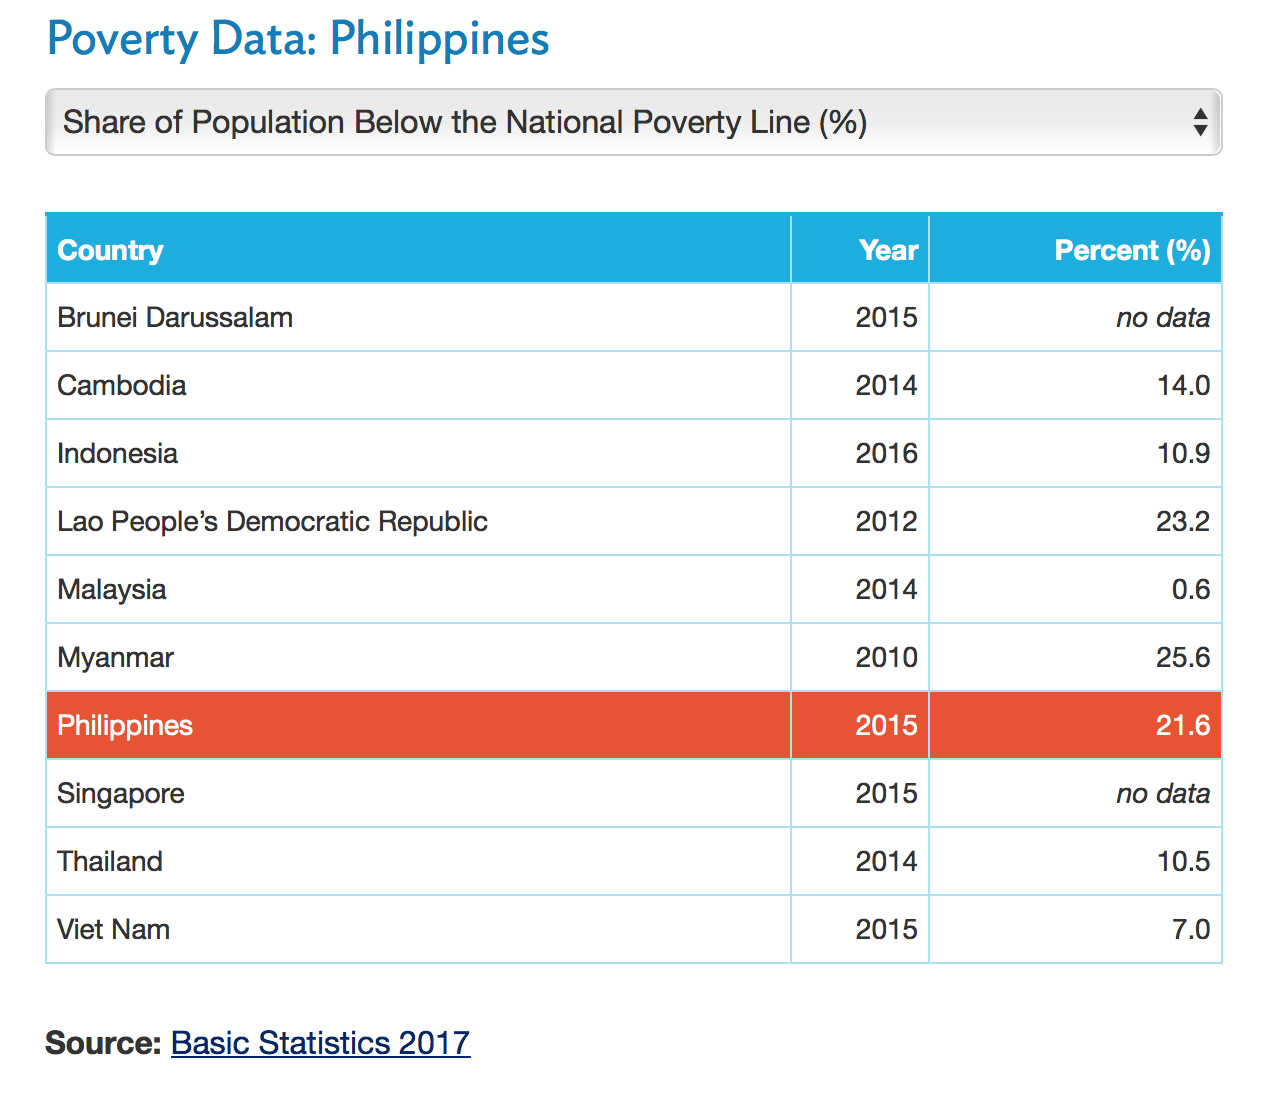
    The poverty incidence among Filipinos dropped to 21.6 percent in 2015 from 25.2 percent in 2012. NONSENSE HOW DO THEY DEFINE POVERTY


    This presents 1.8 million Filipinos lifted out of poverty within three years. LIES


    Sustained economic growth since 2015 increases the likelihood that poverty reduction has continued. Higher wage income, particularly for households in the bottom 40 percent, constituted the main driver of recent poverty alleviation. NONSENSE


    The medium-term growth trajectory remains positive, but the economy is projected to grow at a slower pace than in 2016. The economy is projected to expand by 6.6 percent, year-on-year, in 2017 and 6.7 percent, year-on-year, in 2018 and 2019. Fiscal and monetary policies are likely to remain accommodative to growing the economy, and recovering exports and strong consumption growth are expected to boost economic growth. Higher investment growth could push the country’s growth rate towards the upper end of the government’s target of 6.5 to 7.5 percent of GDP, but this is contingent on whether or not the public infrastructure program gains full traction.


    Last Updated: Oct 05, 2017


    http://www.worldbank.org/en/country/philippines/overview


    International Monetary Fund. Asia and Pacific Dept


    Publication Date:


    November 10, 2017


    Electronic Access:


    Free Full Text(PDF file size is 4487 KB).Use the free Adobe Acrobat Reader to view this PDF file


    Summary:


    The Philippine economy has performed well and is in a favorable position to address its socioeconomic challenges. Sound policies have delivered solid growth, low inflation, financial stability, and external and fiscal buffers. However, poverty remains high and the country needs to create jobs for its young and growing population. Sustaining the growth momentum in an uncertain and volatile external environment requires tackling the constraints to inclusive growth, while protecting policy anchors, adapting policies to changing conditions, and maintaining vigilance against risks, including from high credit growth, loan concentration, and overheating.


    IMF


    Staff welcomes the first tax reform package designed to create additional fiscal space, and encourages the authorities to consider additional revenue measures. The ambitious development agenda depends on a series of comprehensive tax reforms that could create additional fiscal space. Staff appreciates the breadth of the envisaged tax reforms, but cautions that reform efforts may have a lower revenue yield than originally projected because of dilution in Congress. Accordingly, staff encourages the authorities to consider lowering the threshold for PIT, raising


    the VAT rate, rationalizing tax concessions and exemptions, and accelerating the implementation of new excises on automobiles and petroleum products.


    MARIT STINUS-CABUGON


    TAXATION is a means for a nation to mobilize local resources to fund the programs and operations of its government. Too heavy reliance on foreign loans or other schemes with big foreign players could threaten long-term national interest. While we can always question the wisdom of the priorities of the government, the efficiency of project implementation and how the government conducts its business in general—are we getting value for our tax money?—substantial funds are obviously needed for even just the most basic of services such as education and health care, among others.


    Manila Times


    The Tax Reform for Acceleration and Inclusion (TRAIN) that took effect on January 1, is expected to raise an additional P90 billion for the government in 2018. This isn’t really that much when compared to the P3.8 trillion national budget for 2018 and the total revenue target of P2.8 trillion. But every peso counts.


    On the downside of the new taxes is the fact that the increased excise taxes on fuel will have an inflationary effect on prices since fuel is used in production and transportation of goods. The full-year average inflation rate for 2017 was 3.2 percent, much higher than the 1.8 percent in 2016. This might not seem as much but for millions of Filipinos even the smallest increase in prices is felt. For them, every centavo counts. While 7.5 million individual income tax payers will enjoy lower tax rates—6.8 million taxpayers will be completely tax exempt—the very large group of Filipinos who earn their living in the informal economy will feel the impact of higher prices without the matching increase in take-home pay. For perspective, the Philippine Statistics Authority puts the total number of employed Filipinos at 41.5 million (PSA, October 2017).


    WBANK http://www.worldbank.org/en/understanding-poverty


    Fewer people live in extreme poverty than ever before. Even as the world’s population has grown, the number of poor has gradually fallen. LIE


    In 1990, almost 4 in 10 people were living under the international extreme poverty line of $1.90 a day.In 2013, that figure had fallen to just over 1 in 10. But that still represents more than 767 million people. Poverty remains unacceptably high. IT WAS 1.00 IN 1990,


    “Poverty headcount ratio among the population is measured based on national (i.e. country-specific) poverty lines. A country may have a unique national poverty line or separate poverty lines for rural and urban areas, or for different geographic areas to reflect differences in the cost of living or sometimes to reflect differences in diets and consumption baskets. Poverty estimates at national poverty lines are computed from household survey data collected from nationally representative samples of households.”  NOT TRUE THEY ARE SET BY THE  PPP ADJUSTED RATE OF THE 1990 ONE DOLLAR A DAY


    USAID https://www.usaid.gov/frontiers/2014/publication/section-1-extreme-poverty-philippines


    In 2012, extreme poverty in the Philippines was estimated at 19.2 percent of the population, or about 18.4 million people, based on the international poverty line of $1.25 per day. Most of the poor in the Philippines live in rural areas and work in the agriculture sector, mainly in farming and fishing. Urban poverty, however, has been increasing in recent years. Migrants without jobs or with low-paying jobs are unable to afford decent housing. As a result, Philippine cities have high proportions of informal settlers who are among the poorest of the poor.


    Moreover, poverty is severe in parts of the country with high levels of conflict. The Philippines’ 10 poorest provinces are considered either conflict-affected or vulnerable to conflict.


    https://psa.gov.ph/content/psa’s-2017-annual-poverty-indicators-survey-start-july-2017


    https://psa.gov.ph/poverty-press-releases


    https://psa.gov.ph/content/poverty-incidence-among-filipinos-registered-263-first-semester-2015-psa


    The Philippine Statistics Authority (PSA) releases its latest report today on the country’s official poverty statistics for the first semester of 2015.  The PSA report provides the estimates of poverty incidence using income data from the first visit of the Family Income and Expenditure Survey (FIES) conducted in July 2015.

    Poverty incidence among Filipinos1 in the first semester of 2015 was estimated at 26.3 percent.  During the same period in 2012, poverty incidence among Filipinos was recorded at 27.9 percent 2.

    On the other hand, subsistence incidence among Filipinos, or the proportion of Filipinos whose incomes fall below the food threshold, was estimated at 12.1 percent in the first semester of 2015. In the first half of 2012, the subsistence incidence among Filipinos is at 13.4 percent 3.  Subsistence incidence among Filipinos is often referred to as the proportion of Filipinos in extreme or subsistence poverty.

    Food and Poverty Thresholds

    Food threshold is the minimum income required to meet basic food needs and satisfy the nutritional requirements set by the Food and Nutrition Research Institute (FNRI) to ensure that one remains economically and socially productive.  It is used to measure extreme or subsistence poverty.  Poverty threshold is a similar concept, expanded to include basic non-food needs such as clothing, housing, transportation, health, and education expenses.

    During the first semester of 2015, a family of five needed at least PhP 6,365 on the average every month to meet the family’s basic food needs and at least PhP 9,140 on the average every month to meet both basic food and non-food needs. These amounts represent the monthly food threshold and monthly poverty threshold, respectively. They indicate increases of about 17 percent in food threshold and poverty thresholds from the first semester of 2012 to the first semester of 2015 4.

    Poverty among Filipino families

    PSA also releases statistics on poverty among families – a crucial social indicator that guides policy makers in their efforts to alleviate poverty.

    The poverty incidence among Filipino families based on the first visit of 2015 FIES was estimated at 21.1 percent during the first semester of 2015.  In the first semester of 2012, the poverty incidence among Filipino families was estimated at 22.3 percent 5.

    The subsistence incidence among Filipino families, or the proportion of Filipino families in extreme poverty, was estimated at 9.2 percent during the first semester of 2015.  In the same period in 2012, the proportion of families in extreme poverty was recorded at 10.0 percent 6.

    In addition to the thresholds and incidences, the PSA also releases other poverty-related statistics in the report such as the income gap, poverty gap and severity of poverty. The income gap measures the average income required by the poor in order to get out of poverty, expressed relative to the poverty threshold.  The poverty gap refers to the income shortfall (expressed in proportion to the poverty threshold) of families with income below the poverty threshold, divided by the total number of families.  The severity of poverty is the total of the squared income shortfall (expressed in proportion to the poverty threshold) of families with income below the poverty threshold, divided by the total number of families.  This is a poverty measure that is sensitive to income distribution among the poor.

    In the first semester of 2015, on the average, incomes of poor families were short by 29.0 percent of the poverty threshold. This means that on the average, an additional monthly income of Php 2,649 is needed by a poor family with five members in order to move out of poverty in the first semester of 2015.


    https://en.wikipedia.org/wiki/Poverty_in_the_Philippines#Poverty_and_food_threshold


    In general, one out of every five families were poor in 2012. The ratio of poor families remained the same from 2006, but due to population increase, the number rose from 3.8 million in 2006 to 4.2 million in 2012. Furthermore, one out of 10 families couldn’t meet their basic food needs. Nevertheless, the estimated number of poor families remained steady at around 1.6 million.


    The map above shows the poverty incidence in the country. This is the number of households living below the poverty threshold. It can be seen that the provinces of Apayao, Eastern Samar, Lanao del Sur, and Maguindanao have incidences higher than 60%. In Mindanao, apart from Lanao del Sur and Maguindanao, the rest of the region’s provinces have indices that are 60% or lower. In Visayas, the western part contains most of the provinces with lower than 30% incidence, while the eastern part mostly has lower than 60% incidence. Luzon has the least number of provinces with higher than 30% incidence. This may be attributed to their relative ease of trade with the capital.


    https://www.adb.org/countries/philippines/poverty


    1Poverty incidence among Filipinos is the proportion of people below the poverty line to the total population.


    https://www.adb.org/countries/philippines/poverty


    During the first semester of 2015, a family of five needed at least PhP 6,365 on the average every month to meet the family’s basic food needs and at least PhP 9,140 on the average every month to meet both basic food and non-food needs. These amounts represent the monthly food threshold and monthly poverty threshold, respectively. They indicate increases of about 17 percent in food threshold and poverty thresholds from the first semester of 2012 to the first semester of 2015.


    THE GOVERNMENT POSITS THAT 70% OF FAMILY EXPENDITURES ARE REQUIRED TO MEET FOOD REQUIREMENTS


    9140 PHP DVIDIED BY 5 AND THEN DIVIDED BY 30 GIVES THE DAILY PER CAPITA THRESHOLD  61 PESOS A DAY, WHICH IS BELOW THE WB $1.90 PPP 2011 RATE,


    THE FIGURE 9140 Is in CURRENT PHP. It is not IN PPP PHP. SEE BELOW THE 1.25 IN 2005 PRICES IS WHAT THE WORLD BANK MENTIONS,


    61.00 per capita per day, comes to about $1.35 at 2015, the World Bank was suggedsting $1.90 for the 2011 ppp. 


    THE FIGURES ARE IN CURRENT PHP RATHER THAN IN PPP, WHAT THIS MEANS IS THAT THEY HAVE TAKEN THE $1.25 DOLLAR RATE FOR 2005, WHICH ACCORDING TO WORLD BANK WAS A PURCHASING POWER PARITY OF THE ONE DOLLAR RATE FOR 1990,


    DOUBLE FOLD LIE AND MANIPULATION, FIRST THEY DO NOT QUESTION THE WORLD BANK ONE DOLLAR FIGURE AS A MEASURE OF POVERTY, HOWEVER THEY GO WELL BEYOND THE WB IN DISTORTING REALITY, THEY TAKE 1.25 AS THE PER CAPITA POVERTY THRESHHOLD FOR 2015, FIRST SEMESTER


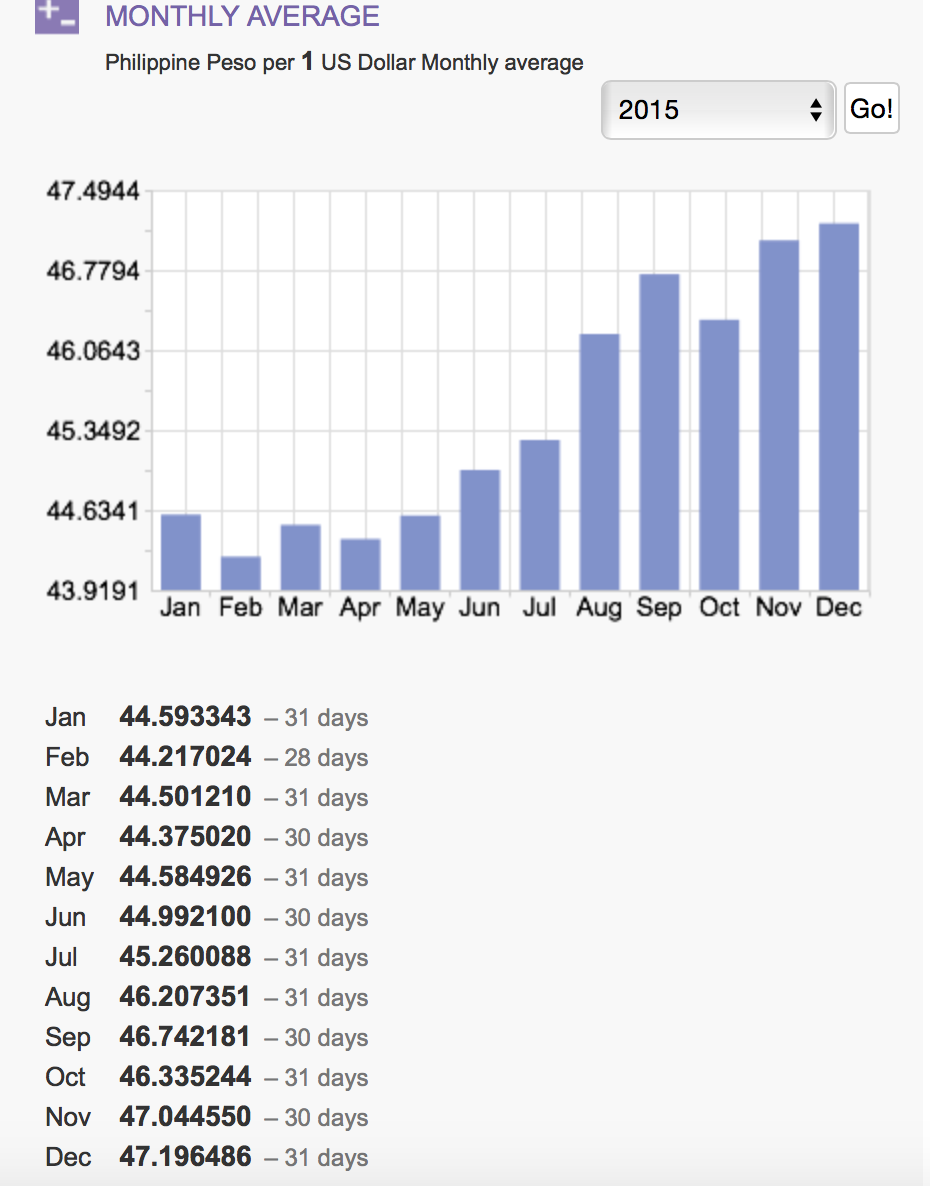
    TAKING 44.5 AS THE $ EXCHANGE RATE first semester 2015, THIS MEASUREMENT DIFFERS FROM THAT OF WB AND THE ADB WHICH POSIT PPP1.90 2011, IN 2015 THE CURRENT PPP VALUE OF THE POVERTY THRESHHOLD WOULD BE WELL IN EXCESS OF $1.90


    https://psa.gov.ph/sites/default/files/attachments/ird/pressrelease/Press%20Release_poverty.pdf


    http://blogs.worldbank.org/developmenttalk/international-poverty-line-has-just-been-raised-190-day-global-poverty-basically-unchanged-how-even


    Although both requirements are sensible, they do have some troublesome implications… In particular, they have led us to adjust the line every time a new (and hopefully improved) set of PPPs is produced.  PPP exchange rates are currently produced by an independent consortium called the International Comparison Program (ICP), which periodically revises its estimates – reflecting both changes in relative price levels across countries and methodological changes. The dollar-a-day line, created by Ravallion et al. (1991), used 1985 PPPs.  When a new set of PPPs was published in 1993, the line changed to $1.08 per day. PPPs were revised again in 2005, and the line was correspondingly upped to $1.25. Every time this happened, there were real comparability challenges, and international poverty rates were revised for individual countries and for the world.


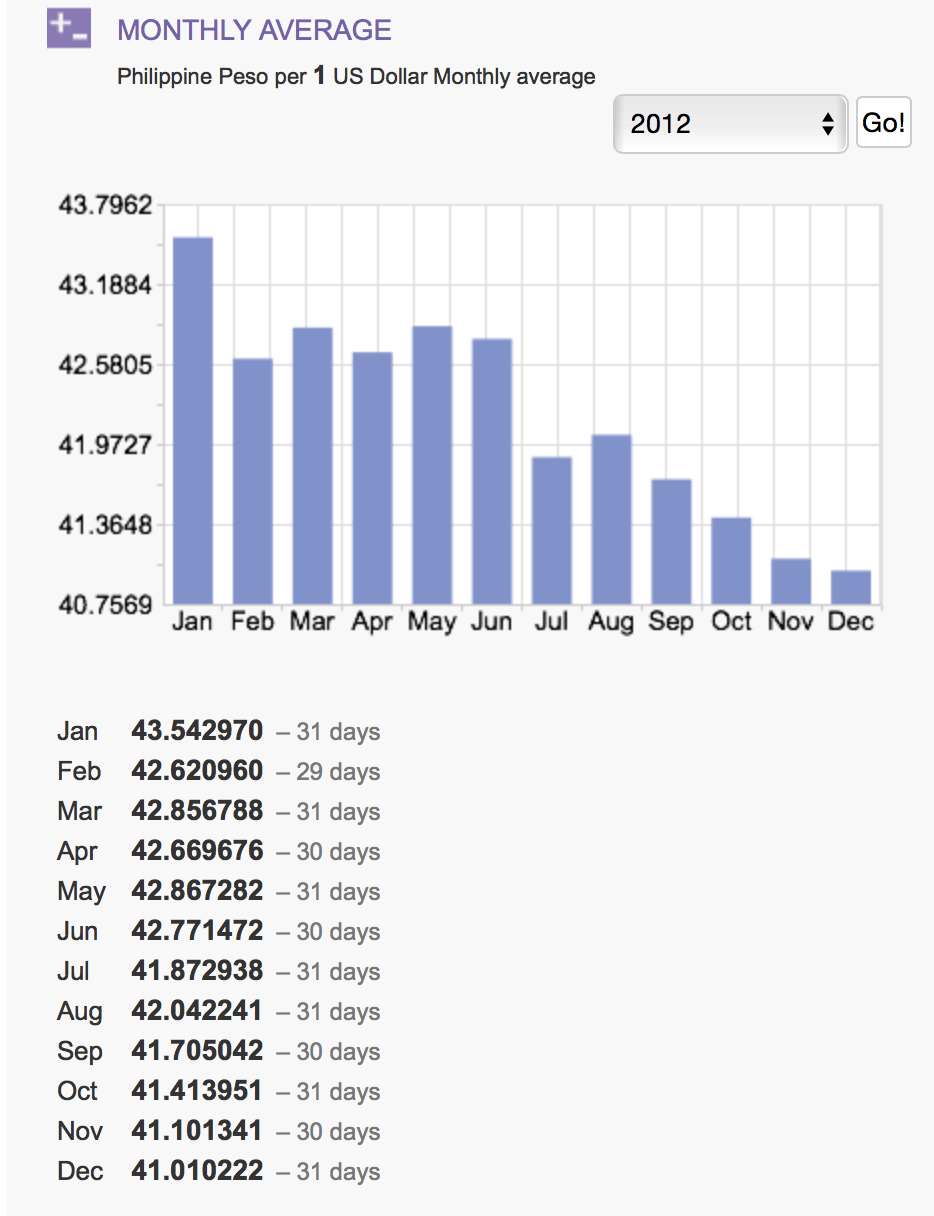
    Last year [2014], the ICP published yet another new set of PPPs, for prices collected in 2011. Though there was some disagreement among scholars, the dominant view is that these new PPPs represent an improvement over the 2005 set, creating the need for another revision to the Bank’s international poverty line. The challenge was: over time, the Bank’s international poverty line had begun to serve as a benchmark for the definition of high-level policy goals for the international community, such as the first Millennium Development Goal. More recently, the first overarching goal of the World Bank itself – reducing the global incidence of extreme poverty to 3% by 2030 – was set in terms of “those living under $1.25 per person per day, at 2005 PPPs”.  NOTE THIS CRITERION INS NOT APPLIED BY PHILIPPINES STAT. IN 2012 THEY USED 1.25 AT CURRENT PRICES, EXCHANGE RATE APPROX 42


    The same is true of the first Sustainable Development Goal, to which world leaders signed up at the UN just over a week ago.


    https://psa.gov.ph/content/poverty-incidence-among-filipinos-registered-263-first-semester-2015-psa


    THE FIGURES IN THE FIRST SEMESTER OF 2015 ARE IN CURRENT PHP AS INDICATED BELOW


    During the first semester of 2015, a family of five needed at least PhP 6,365 on the average every month to meet the family’s basic food needs and at least PhP 9,140 on the average every month to meet both basic food and non-food needs. These amounts represent the monthly food threshold and monthly poverty threshold, respectively. They indicate increases of about 17 percent in food threshold and poverty thresholds from the first semester of 2012 to the first semester of 2015 4.


    https://psa.gov.ph/content/poverty-incidence-among-filipinos-registered-216-2015-psa


  • The Philippine Statistics Authority (PSA) releases its latest report today on the country’s official poverty statistics for the full year of 2015.  The PSA report provides the estimates of poverty incidence using income data from the first and second visit of the Family Income and Expenditure Survey (FIES) conducted in July 2015 and January 2016, respectively.


    On the other hand, subsistence incidence among Filipinos, or the proportion of Filipinos whose incomes fall below the food threshold, was estimated at 8.1 percent in 2015. In 2012, the subsistence incidence among Filipinos is at 10.4 percent3 .  Subsistence incidence among Filipinos is often referred to as the proportion of Filipinos in extreme or subsistence poverty.


FIGURES FOR 2012


For the full year 2012, a family of five will need around PhP 5,513 monthly income to buy their minimum basic food needs; and around PhP 7,890 monthly for their minimum basic food and nonfood needs.

This represents an increase of about 12.3 percent for both the food and poverty thresholds between 2009 and 2012.  Such increases represent inflation of about 4.1% on the average per year between 2009 and 2012.

In the same period in 2012, the proportion of Filipino families in extreme poverty whose incomes are not sufficient to meet basic food needs stands at 7.5 percent, which is almost the same in 2009 but the figure in 2012 is significantly lower than the 8.8 percent estimate in 2006.

7890 DIVIDED BY 30 DVIDED BY 5,   52.6 PHP A DAY, AT AN EXCHANGE RATE OF 42 BASED ON THE $1.25 CRITERION VFOR THE YEAR 2012


Print