


by Mish Shedlock, The Maven:
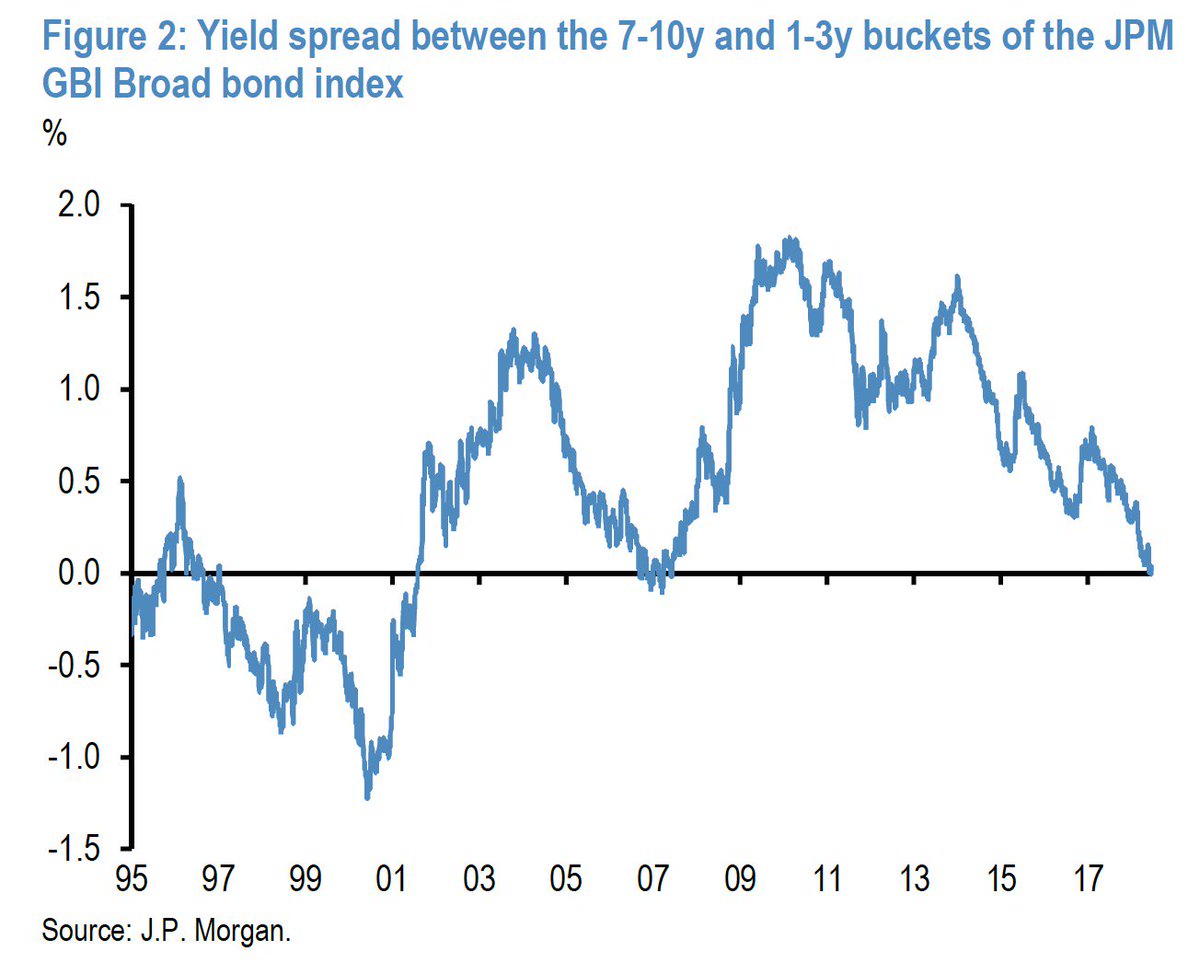 JP Morgan is following yield spreads on the GBI broad bond index. Things are getting serious says one analyst in a Tweet
That Tweet by Holger Zschaepitz got me thinking more about the flattening US treasury yield curve. Most analysts follow the 10-year to 2-year spread. The Tweet mentioned 10-year to 7-year and 1-year to 3-year spreads. Here are some charts I created in Fred.
Yield curve gets serious, JPM says: Last time 7-10y minus 1-3y yield spread of our GBI Broad bond index turned neg was in 2007, ahead of GFC. Before then it had turned very neg after 1997/1998 EM crisis but also in 1999 ahead of a burst in the equity bubble. via @Daniel_March3 pic.twitter.com/AlgFI5WfRD
— Holger Zschaepitz (@Schuldensuehner) 17 June 2018
10-Year Minus 7-Year Spread

This portion of the yield curve looks highly likely to invert soon. That said, predicting recessions off such divergences is clearly problematic.
3-Year Minus 1-Year Spread

This is another unusual spread to watch. It’s currently at 34 basis points. Assuming the 1-year yield rises 25 basis points on a Fed hike (probable), but the 3-year yield doesn’t (questionable), the Fed could get in no more than one more hike before this portion of the yield curve inverts.
10-Year Minus 2-Year Spread

This chart is so popular that Fred has it precalculated. I created the first two charts and the following chart using Fred tools.
The last three recessions all started with 10-2 spreads higher than 35 basis points. Thus we are already well into recession territory. The one missing ingredient is a prior 10-2 inversion.
