Select date

DK Analytics, Post #47: with rising interest rates, if you must buy, purchase “value” vs. “growth” stocks — and then some


by Dan Kurz, DK Analytics:
DK Analytics, Post #47: with rising interest rates, if you must buy, purchase “value” vs. “growth” stocks — and then some 9/20/2018
Trade weighted US$: 90.03; US 10-yr: 3.08%; S&P 500: 2,908; Oil: $71.66; Gold: $1,212; Silver: $14.34
A historical interest rate perspective — the US & the world have never been so indebted in both relative to GDP and in absolute terms, yet look at our interest rates:
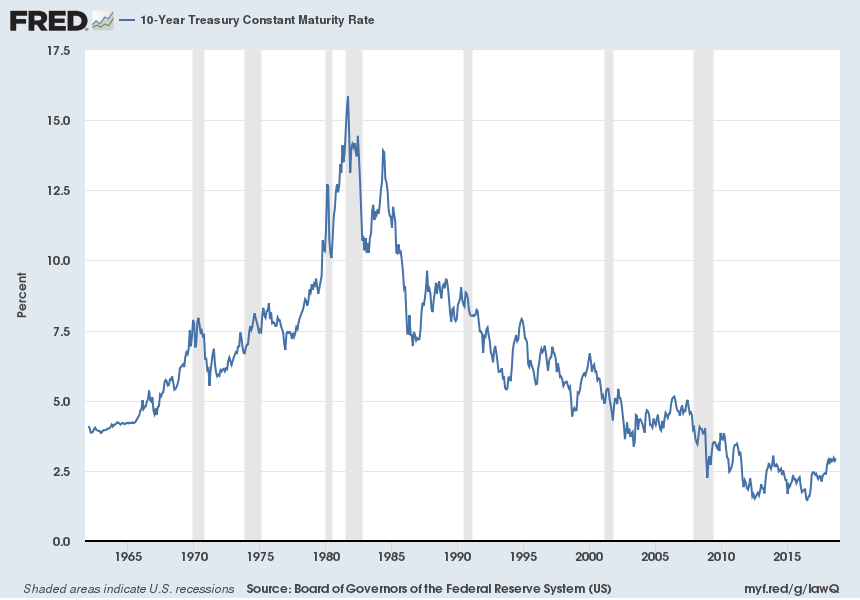
Source: https://fred.stlouisfed.org/series/DGS10
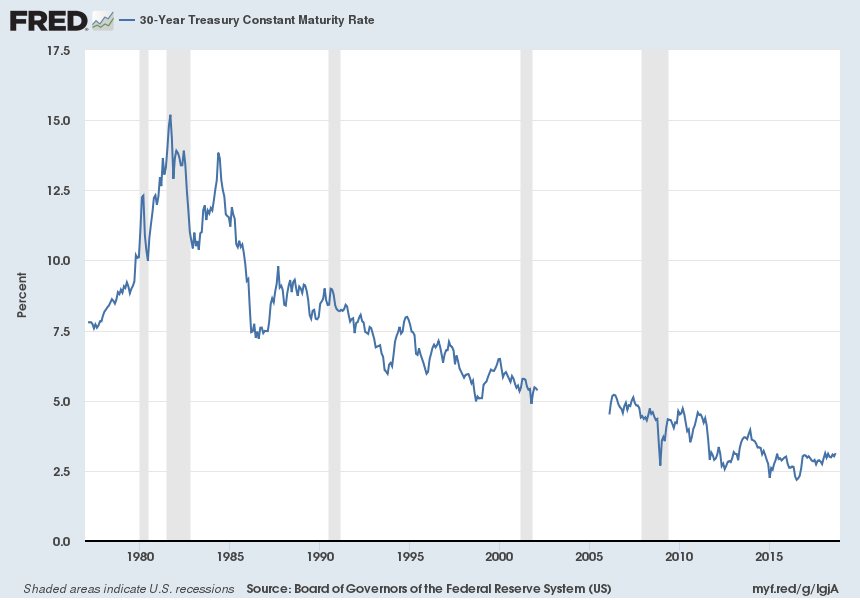
Source: https://fred.stlouisfed.org/series/DGS30
The real risk-free rate since 1311 (translation: risk-free, inflation-adjusted borrowing cost or interest rate)
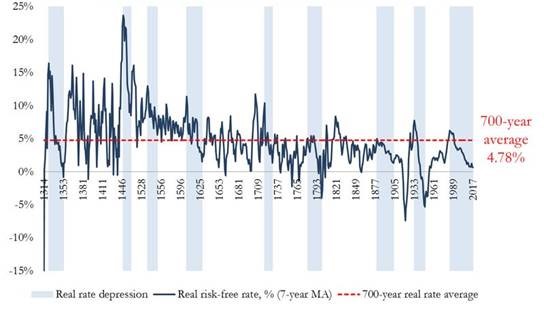
Source: www.bloomberg.com/news/articles/2017-11-07/centuries-of-data-forewarn-of-rapid-reversal-from-low-interest-rates. For flavor of what higher discount rates would do to the current S&P 500 valuations, click here:
First, after 10 years of global financial repression and on the eve of unprecedented QT, the US stock market (and a rapidly declining part the world’s stock market), is historically expensive prior to an overdue recession that should pummel EPS:
S&P 500 P/E based on trailing 12-month GAAP EPS
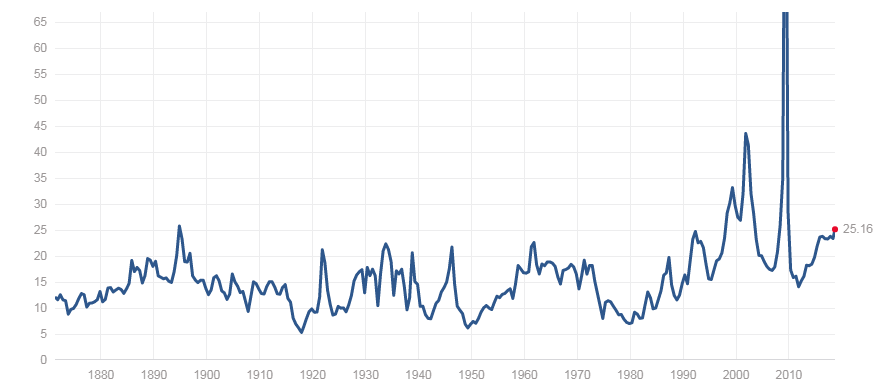
Source: http://www.multpl.com/
In terms of the 25 P/E multiple, consider that S&P 500 EPS are being legislatively “juiced” (lower tax receipts amidst record and growing federal government spending) into very transitory double-digit growth. Contrast this with from otherwise very pedestrian, low single-digit GAAP-based EPS growth between 2006 and 2017 (p. 2).
In particular, that “juice” is coming from a pronounced one-time reduction in the combined corporate tax rate (when considering federal and state levies, from nearly 40% to 25%), from massive profit repatriation under a lower repatriation tax (in the main, 15.5% vs. 35%), and from the ensuing record, possibly $1trn plus, repatriation-fueled stock buybacks. Upshot: 2018 S&P 500 EPS, which are tabulating stout 18% year-over-year growth through Q2:2018, would be much lower — and the S&P 500 P/E would be much higher — were it not for these unsustainable (one-time) developments.
This is thrown into sharp relief when examining the lackluster average EPS growth of 2.8% p.a. between 2006 and 2017. Punk average GAAP (“true”) EPS expansion has long lacked stout organic (top-line) growth, which is unsurprising for nominal annualized EPS growth cannot consistently outstrip nominal annual GDP growth (slide 3), an “econ 101” given. What is more embarrassing, and also frankly foreboding, is that despite unprecedented debt-financed share buybacks with “cheap money” that are looking eerily like “public LBOs,” domestic personnel reductions, and stagnant nominal cap ex and the ensuing moderating depreciation expense (in a nutshell, “corporate anorexia“), 2.8% EPS compounding was the best that a massively overpaid, stripped of parallel strategic interests “C-Suite” could “conjure up” from 2006 to 2017. (And yes, Virginia, we do have to deal with EPS eviscerating recessions, which haven’t been render obsolete, and with big bath “hacking” charges/confessions in continuing business lines when looking at longer-term EPS compounding.)
The financial engineering-driven (versus real engineering-paced), anorexic, American C-Suite legacy threatens to magnify EPS compression prospects during the next recession from both corporate debt encumbrance and from weak product portfolio vigor perspectives. A run-of-the-mill, 40-50% EPS reduction, magnified by the ephemeral tax rate reduction and repatriation-driven “shooting star” EPS surge we’re witnessing, might be substantially exceeded to the downside, and stock buybacks at bubble levels will invariably (again) be followed by EPS diluting secondary stock offerings at “bust” stock prices, adding insult to thinning earnings slice injury.
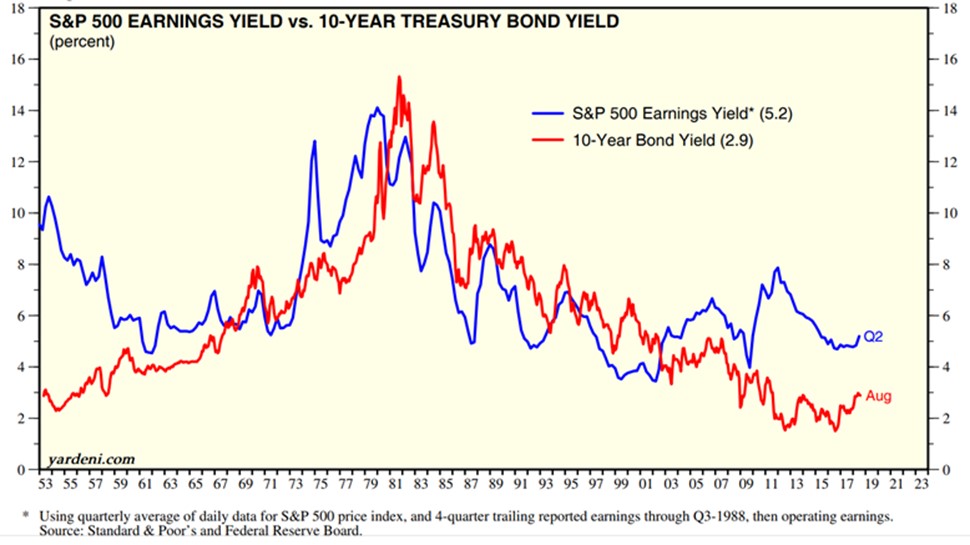
Second, as bond and stock valuations are tied at the hip, rising rates have a similar impact — “bonds and stocks travel together:”
- An increase in the return sought will cause a reduction in the NPV of the benchmark bond (the 10-year Treasury). This is expressed as a rising bond yield and a falling bond price.
- The same holds true for stock valuations/NPVs. When the discount rate (benchmark interest rate plus risk premium) rises, P/Es and stock prices (S&P 500) fall, and the “E/P,” or “earnings yield,” rises.
- Thus earnings yields and bond yields move in tandem:
Source: www.yardeni.com/pub/sp500trailpe.pdf
Please note: if yardeni.com had continued to use appropriate, GAAP-based S&P 500 EPS, instead of bloated/devoid of recurring restructuring charges EPS as of Q3:1988, the mid-September 2018 four-quarter trailing E/P — or earnings yield — of the S&P 500 would be 4.0%, not 5.2%, as stated in the above chart. Looked at another way, investors should be seeing a S&P 500 P/E of 25.2, not 19.3, as a 5.2% E/P implies. And, BTW, all those analysts claiming that recurring restructuring charges (delayed, typically massive expense recognition in continuing business lines also known as “big bath accounting”) can be “ignored” when examining EPS, also eagerly tout the higher ROEs achieved thanks to the charges-based equity hits, which obviously magnify future returns on equity! How does one spell “hypocritical!” Fortunately, the market can see through some of this, which is why banks and other financial entities prone to large periodic loan or asset write-downs are typically awarded only niggardly P/E valuations.
Loading...

