Select date

Global GDP Still Propped Up By A Massive Amount Of Debt


by Steve St. Angelo, SRSRocco Report:

While the government agencies and economists continue to publish strong GDP figures, they seem to overlook how much debt it took to produce that growth. Or should I say, the “supposed growth.” The days of adding one dollar of debt to get one dollar of GDP growth have been long gone for more than 40 years. And, as global debt has increased, it has forced governments to lower interest rates.
Yes, it’s really that simple. I get a good chuckle when I hear analysts talk about rising interest rates to 10-15%. If the U.S. Government interest rate on the Treasury Bonds increased to just 5%, Uncle Sam would be paying over a trillion dollars a year just to service the debt. So, no… we aren’t going to see 10-15% rates again.
Well, we could… but, most of the global debt would have to collapse or be forgiven. Unfortunately, if global debt vaporizes or is forgiven, then the entire economy collapses as well. We must remember, GDP growth is also driven by oil production growth. There is no way in HADES that the oil industry can fund future production with 10-15% interest rates. IT JUST AIN’T GONNA HAPPEN.
Why? If it weren’t for the Fed dropping rates down to nearly zero, the Great U.S. Shale Oil Ponzi Scheme and the six million barrels per day of unprofitable shale oil production would have been a pipe dream. I can assure you that the shale oil industry could not fund operations or service their debt with 10-15% interest rates.
Most shale oil companies are paying on average between 4-5% interest to service their debt. If the companies’ interest rates double or triple, then it would make it extremely difficult to service the shale industry debt that is estimated to be $280-$300 billion.
However, this article isn’t about the about the Great U.S. Shale Ponzi Scheme; rather it’s about the global debt bubble propping up the economy.
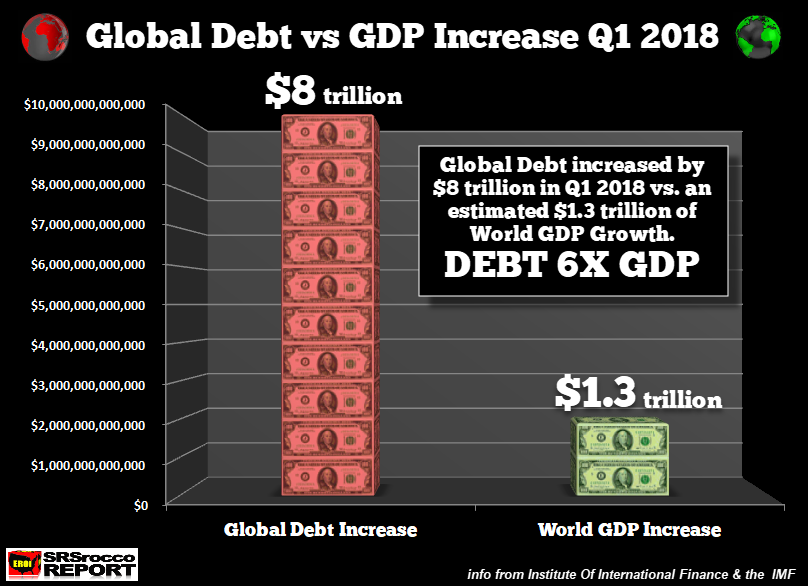
Global Debt Increased More Than Five Times The GDP Q1 2018
According to data from the IMF and the Institute of International Finance, global debt increased four times more than the GDP growth during the first quarter of 2018. The IMF forecasts Global GDP to reach $84.8 trillion in 2018 and the Institute of International Finance reported total world debt increased by $8 trillion in the first quarter of 2018. Thus, I estimated that Q1 2018 GDP growth was $1.3 trillion, one-quarter of the $5 trillion increase from last year.
So, the world is now adding an astonishing six dollars of debt for each dollar of GDP growth:
Now, this is just an estimate as the quarterly GDP dollar figures aren’t released, but the debt is still rising at least fives times more than the GDP. It is quite amazing to see the global debt increase at such a rapid rate. The following chart (courtesy of Bloomberg), shows how much the global debt has grown over the past 15 years. However, since Q1 2008, global debt has jumped by more than $70 trillion.
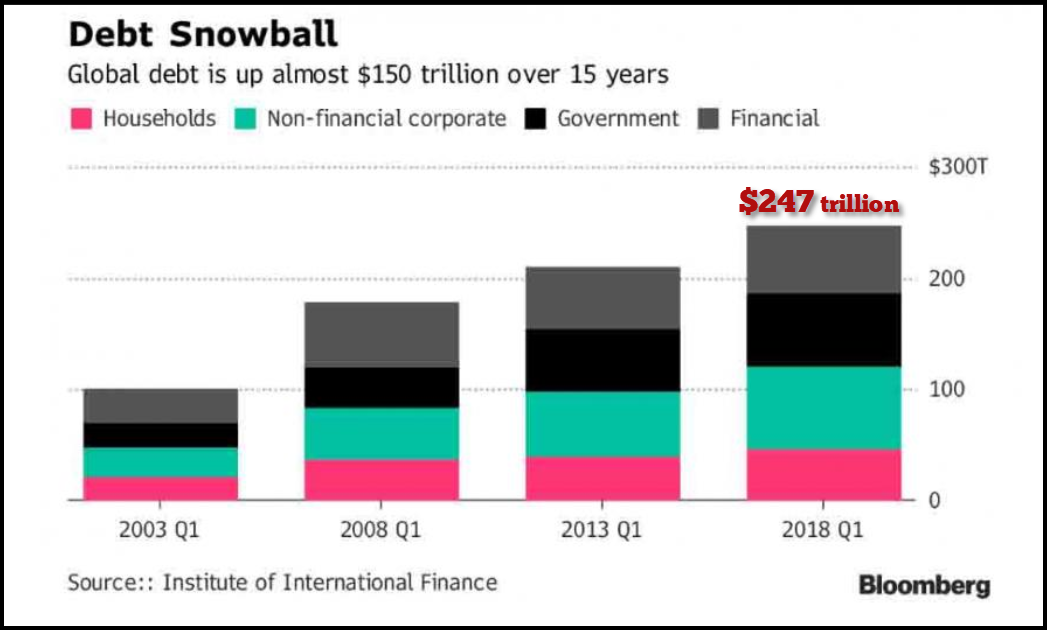
Thus, the average annual global debt increase is approximately $7 trillion. So, to see world debt balloon by $8 trillion in the first quarter of 2018 shows just how much more the Central Banks are motivated in propping up the markets.
On the subject of Central Banks, the U.S. Government continues to rack up its public debt which has now reached $21.7 trillion… up $1.2 trillion since the same period last year. As I have mentioned, rising debt and interest rates forces Uncle Sam to pay a great deal more to service the debt:
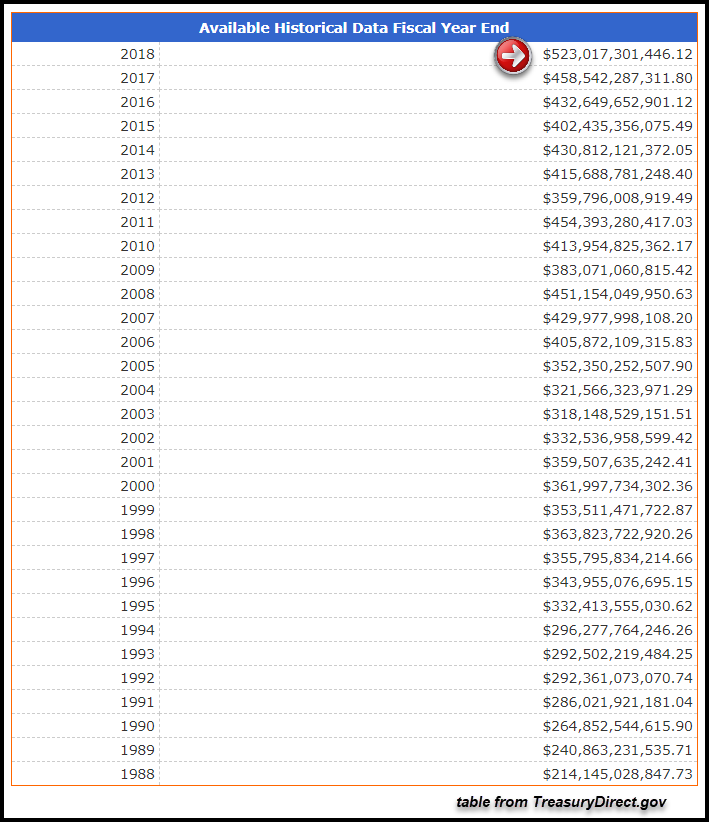
Now that the U.S. Treasury has to pay more than a half trillion just to service its debt, I hardly doubt the Federal Reserve is going to allow rates to rise above 3% anytime soon. According to the TreasuryDirect.gov, the interest expense of $31.7 billion paid for October jumped by a stunning 30%, compared to $24.4 billion during the same month last year.
Even though $7 billion of additional interest expense in one month doesn’t seem like much compared to the trillions of debt being added, it adds up to a lot of stuff:
$7 billion = 30,000 homes (valued at $232,000)
$7 billion = 200,000 cars (valued at $35,000)
$7 billion = half annual Global Silver Mine supply
And again, this is just the additional U.S. Government interest expense for one month. Unfortunately, Americans have become oblivious to the staggering amount of debt in the system. Furthermore, the public and investors are also immune to the tremendous volatility taking place in the markets.
For example, one of the industrial bellwethers of the Dow Jones Index, Caterpillar, has seen its share price go into cardiac arrest over the past six months:
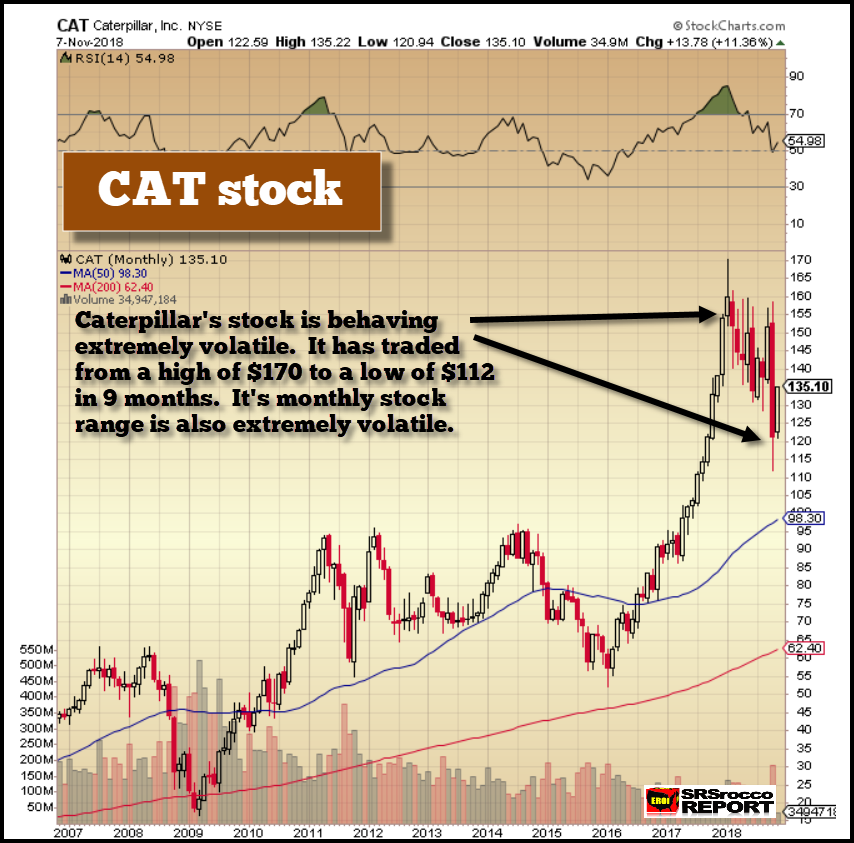
Caterpillar hit a high of $170 at the beginning of the year and a low of $112 last month. That is a 34% correction in a little more than six months. Moreover, if you look at the candlesticks on the upper right-hand of the chart, you will see the tremendous volatility not experienced in the past ten years.
In crazy October, Caterpillar’s stock traded between a high of $159 and a low of $112. That is a $45 movement from one of the leading manufacturing blue-chip stocks in just one month. Caterpillar is not supposed to trade in this manner, but this is the NEW NORMAL in a market that is about to go HOG WILD.
While the broader markets corrected higher from the lows last month, investors should not think the worst has passed. Oh no… the worst is yet to come. Nothing goes up or down in a straight line, but this economic cycle is nearly ten years long in the tooth and at some point will need to correct back towards reality. Caterpillar will likely have to fall back to its 200 Month Moving Average of $62, which is more than 50% lower from where it is trading today.
Read More @ SRSRoccoReport.com
Loading...
 money")

