Select date

Income Inequality and the Decline of the Middle Class in Two Charts


by Charles Hugh Smith, Of Two Minds:

Now look at the middle quintiles–the middle class: their income has gone nowhere in the past decade.
These two charts of average incomes of U.S. households by quintile (bottom 20%, middle 60% (20%+ 20%+ 20%) and top 20%) have both good news and bad news. (Charts are from the non-partisan Congressional Budget Office — CBO).
These charts depict 1) household income before transfers (means-tested government benefits) and taxes, in other words, pre-tax earned income, income from capital gains and interest, unemployment insurance, etc., and 2) income after federal transfers and taxes.
This is a much more accurate view of household income, as this is what gets deposited in households’ accounts.
The typical chart of average incomes doesn’t include government transfers, so it under-reports the actual income of households receiving means-tested government benefits. (Note that the CBO methodology may not include all government transfers, as not all transfers are means-tested, i.e. based on income and other qualifying factors.)
The CBO reports periodically on the Distribution of Household Income and Federal Taxes, but it doesn’t generate these charts every year. (Go to Congressional Budget Office reports and scroll down to Distribution of Household Income and Federal Taxes).
Here’s the CBO’s summary of what the charts depict:
Means-tested transfers and federal taxes cause household incomes to be more evenly distributed. Those transfers and taxes:
Increased income among households in the lowest quintile by $12,000 (or more than 60 percent), on average, to $31,000.
Decreased income among households in the highest quintile by $74,000 (or more than 25 percent), on average, to $207,000.
While the gap between $31,000 and $207,000 is the core issue in rising income inequality, taxes and means-tested programs do make a big difference:a 60% gain in household income is significant.
As for the top 20%, this income is heavily skewed by the top 0.1%, those earning millions or tens of millions of dollars annually. A more accurate look can be found here:Summary of the Latest Federal Income Tax Data, 2018 Update.
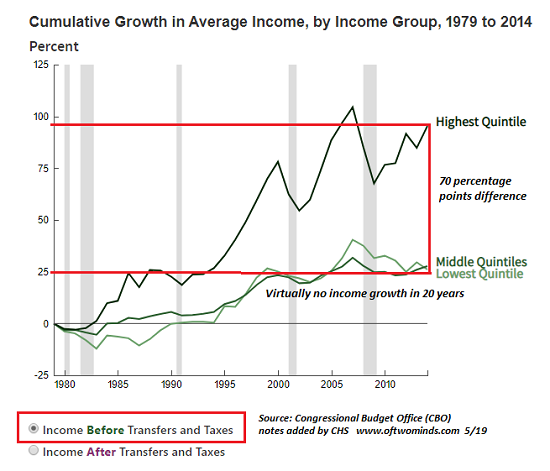
Note that the charts depict cumulative income growth as percentages, with zero being set in 1979.
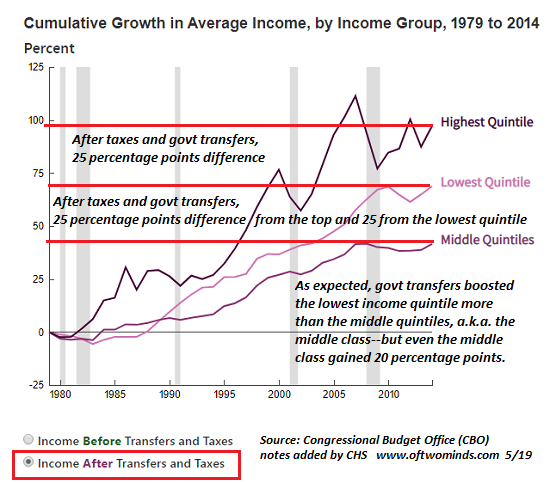
Let’s call this the good news: yes, income inequality is soaring, but America’s progressive tax system (the wealthy pay higher rates) and government programs transfer income from the top households to the bottom households–pretty much in line with the political mandate of the majority of Americans.
The bad news is the middle class has received no real income gains in the past 20 years, and they don’t qualify for many means-tested transfers. I’ve marked the charts up to highlight this.
In the income before transfers and taxes chart, the lowest and the middle quintiles are about where they were in 1999. Both gained ground in the 2005-08 housing bubble, but as with all bubbles, the effects only lasted as along as the bubble itself.
Since the top quintile’s income accelerated away from the bottom 80% in the early 1990s, there is a 70 percentage point gap between the top 20% and the bottom 80%. I’ve addressed the reasons for soaring income-wealth inequality here many times, but the key takeaway is the enormous gains reaped by the top 20% during asset bubbles, which are the consequence of financialization and central bank-fueled speculation.
Loading...


