Select date

In the Wake of Fukushima. Imagining Disasters in the Era of Climate Change: Is Japan’s Seawall a New Maginot Line?


Introduction
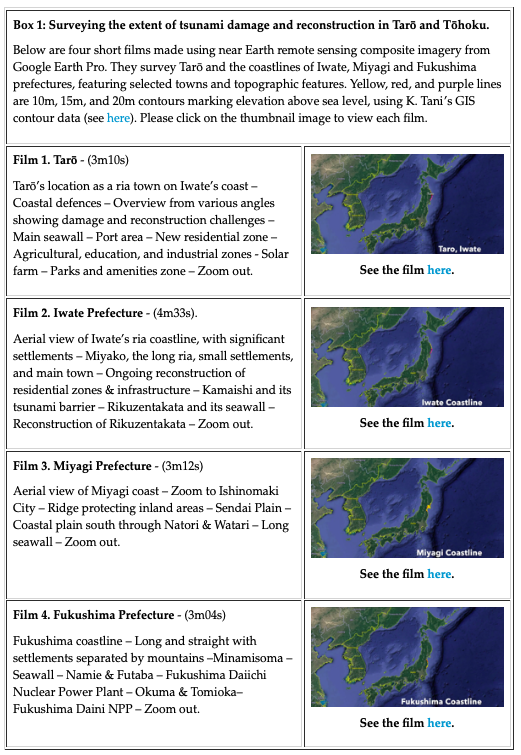
Following the Great East Japan earthquake, tsunami and nuclear disaster of 11 March 2011, in 2012 the Japanese government began constructing a series of 440 seawalls along the north-eastern coast of Honshu. Cumulatively measuring 394.2 km (Table 1), they connect with natural formations along the coast of the three eastern prefectures of Tōhoku – Iwate, Miyagi and Fukushima – to form a single barrier against destructive tsunami that frequently strike the region.1 In 2011, for example, the majority of casualties and damage were due not to the earthquake, but the tsunami that struck approximately forty minutes later, as existing defences were overwhelmed, and communities swept away (Box 1). Nationwide a total of 18,440 people have been declared dead or missing, with 121,852 buildings totally destroyed and 281,042 half-destroyed (NPA, 2016).2
We present a case study of the new tsunami defences taking shape in Tarō in Iwate Prefecture,3 a town which had previously constructed 2.4 kilometres of seawall of between 10 and 13.7 metres in height in the wake of two tsunami in 1896 and 1933, which was destroyed in 2011. Tarō’s example is significant because its experience prior to 2011 informs post-2011 reconstruction plans and their rationales in Tōhoku. Though, as we argue below, climate change4 is a present-day reality worldwide and all coastal regions need to consider whether and how they adapt to the particular risks facing their communities.
Despite the accumulation of research into the 2011 disaster in Japan, perhaps due to Tarō’s small size and merger into Miyako City, with the notable exceptions of Smits’ (2014: 51-52, 174-75), Strusińska-Correia’s (2017), and Takezawa’s (2016: xix, 178) mentions of the town within the context of larger studies, there has been no detailed scholarly analysis in English about this town’s experience of tsunami. Moreover, few studies in English provide a close examination of specific local infrastructures; and those researchers who do examine local structures rarely frame their descriptions within a broader contextual analysis. Furthermore, although excellent overview analyses of post-2011 tsunami defence infrastructure in Japan are available (See: Strusińska-Correia, 2017 and Suppasri et al, 2016), we know of no case study in English which situates post-tsunami settlement reconstruction and defence along the Tōhoku coastline within the context of Japan’s historical development and experience with tsunami, and which simultaneously addresses the twin 21st century challenges of depopulation and climate change, in particular global warming driven sea level rise.
Below we provide a detailed empirical study of the history of Tarō’s tsunami experiences, an analysis of the reconstruction of the town and its seawall since 2011, and we situate these within Tōhoku’s and Japan’s 20th and 21st century contexts. Significantly, we take careful note of the consequences of global warming driven sea level rise for presenting a new contextual environment requiring transformative adaptation in tsunami disaster risk reduction.
Our study employs a multi-disciplinary and multi-methods approach for triangulation, depth, and rigour, including inductive and deductive information gathering and cycling, in accordance with case study analysis for sustainability research in critical human geography (Yin, 2004; Fahy & Rau, 2013; Graham, 1999; Madsen & Adriansen, 2004). Our research is therefore significant for informing resilience building in post-growth settings worldwide in an era of climate change, wherever coastal communities are under threat of tsunami inundation. The study includes:
- Systematic review of central and local government planning documentation,
- Historical near-Earth composite imagery in combination with ground level photographic observation for longitudinal verification and accuracy,
- Participant observation involving five site visits to Tōhoku between 2011 and 2017 – the most recent including ten days driving the length of the eastern Tōhoku coastline – to observe settlement and defence reconstruction in various locales, interact with local residents, and experience post-tsunami local life.
- Interviews and information checks with Japanese local and central government officials and geological scientists.
In this research we inquire into the necessity of the reconstructed tsunami defences at Tarō, given that Tarō’s population is shrinking, residential zones are being relocated to higher ground, and escape routes improved. Indeed, as we shall see, the wall may be counterproductive to efficient and rapid escape to higher ground. Second, we ask how effective these defences will be against future tsunami. All but one of the manmade tsunami defences built in Tōhoku failed in 2011, with just Fudai Village’s massive wall and gate, which lie inland and are thus more effective, surviving intact while allowing overtopping, resulting in just one death (Normile, 2012; Suppasri et al, 2013; Takezawa, 2016). Significantly, none of the government’s published post-2011 recommendations imagine the potential scale of future tsunami by including global warming driven sea level rise as a transformative change in the local risk environment. We ask, therefore, whether the government’s rationale for the wall is sufficient and whether it has properly imagined the next disaster.
Although DeWit (2014; 2016a; 2016b) argues for Japan’s success with post-Fukushima energy resilience and climate change mitigation (in the service of a growth-first neo-liberal political economy),5 rather than adopting a necessarily transformative policy of adaptation to climate change by strengthening coastal community resilience and sustainability for an era of depopulation, global warming, and increasing severity of ‘mega disasters’ – as is the government’s stated objective (MLIT, 2014 & 2015) – we contend that the seawall represents an incremental improvement on pre-2011 defences. The wall is thus more aptly understood as a continuation of the 20th century Japanese Construction State and its habitual deployment of concrete infrastructure to correct for an assumed dangerous and defective nature (See: Bird, 2013; Takezawa, 2016) We conclude by arguing against preparing for the past by failing to imagine the future, and we invoke the philosophy of Tanaka Shōzō, father of Japan’s modern environmental movement, who urged Japanese to live within and adjust to the flow (nagare) of nature, rather than fight against it, lest they are undone by the force of its backflow (gyakuryū) (Stolz, 2007; 2014; Tanaka, 2004 & 2005).
Before describing the historical context of Tarō’s decision to build its wall, we need to clarify three issues. First, we are as concerned as anyone about the levels of greenhouse gasses (GHG) in the Earth’s atmosphere, which passed 415ppm of carbon dioxide concentration for the first time in human history on 12 May 2019 (Scripps Institution, 2019). Japan bears a heavy responsibility both as the world’s third largest economy and its accumulated historical emissions as the earliest industrialised country in Asia. Nevertheless, this article is about coastal adaptation to the actual or expected outcomes of climate change, and discussion of mitigation measures is beyond our scope. Second, we do not wish to single out Japan as exceptionally unresponsive to climate change. Rather, nearly all countries are doing considerably less than necessary to acknowledge, prepare for, and adapt to sea level rise, among many other outcomes of global warming. Third, our research is rooted in the perspectives of critical human geography and we do not offer alternatives or solutions, which again would be beyond our scope and a distraction from our focus on the reconstruction of Tarō and its tsunami defences.
.png)
Tarō and Sanriku on 11 March 2011
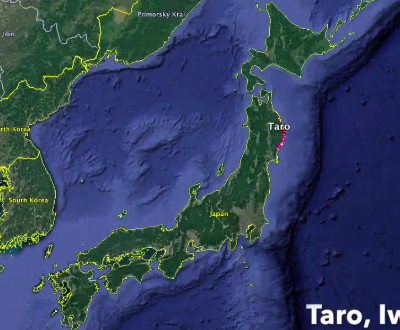
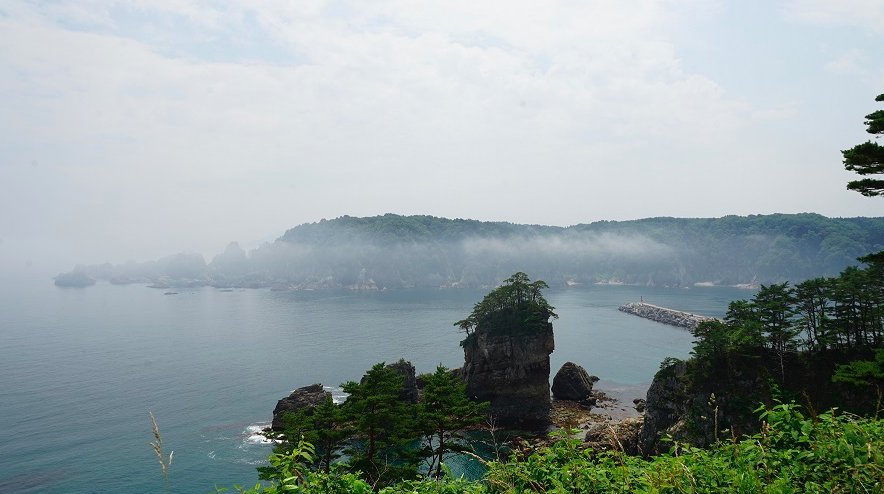
Tarō is located in the northern part of the Sanriku region of Iwate and Miyagi Prefectures (Box 1); located approximately 130km west of the Japan Trench tectonic subduction zone. The area is famous for its picturesque ria coastline (Photo 1),6 with settlements built on narrow alluvial fans nestled between steep forested mountainsides at the head of each ria. Tarō is one such town.
Photos 1-4,7 Click on the hyperlinks for a Google Earth view.
- Photo 1: The entrance to Tarō’s ria, showing a bank of tetrapods, reconstructed since 2011. Tsunami amplification due to the ria’s topography can be deduced from this image.
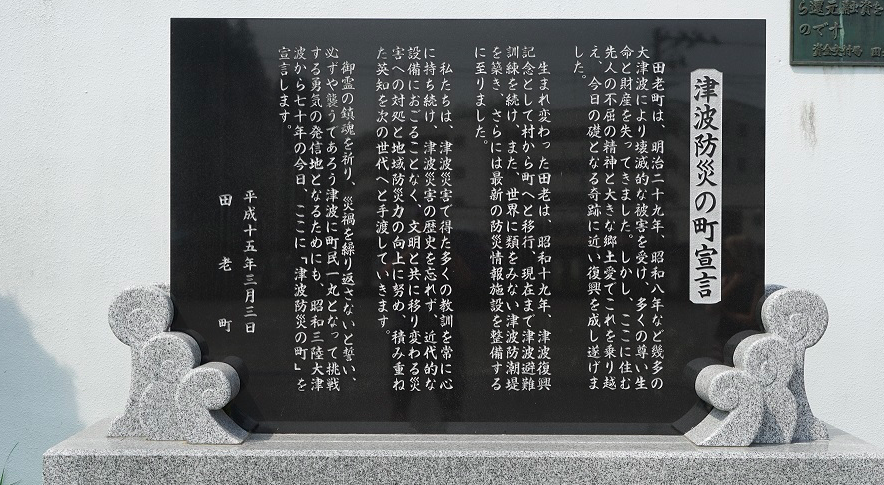
- Photo 2: The ‘Tsunami Prevention Town Declaration’ (Tsunami bōsai no machi sengen) inscribed in granite and placed at the entrance to Tarō’s administrative offices, post-2011.
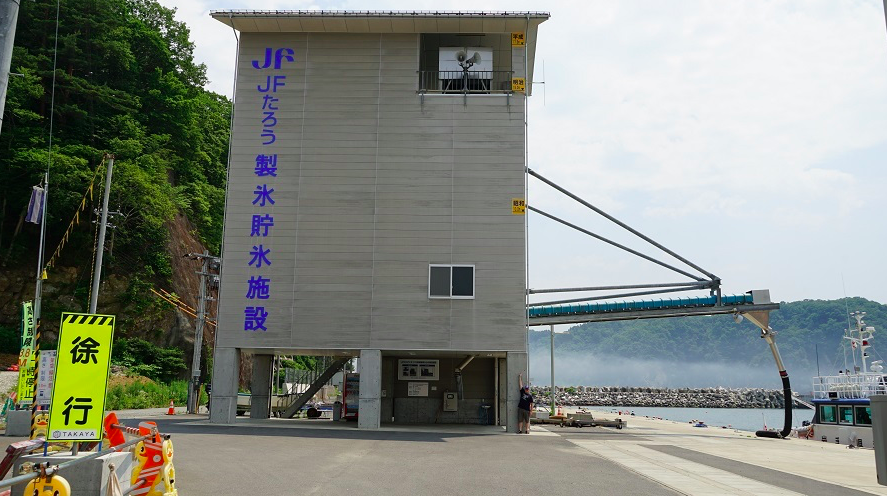
- Photo 3: The Tarō Fishing Coop port tower, with yellow markers for the 1896, 1933 & 2011 tsunami, displaying 17.3m for the latter. For scale, Peter Matanle is under the markers.
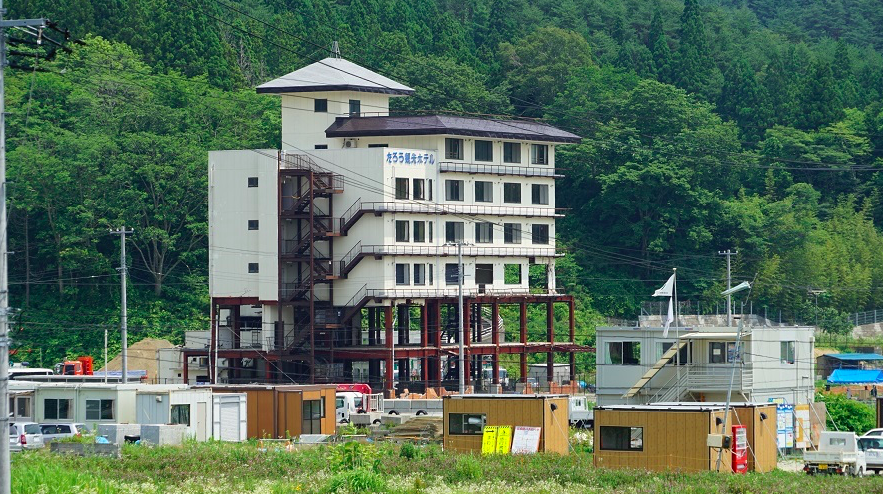
- Photo 4: The Tarō Kankō Hotel from where Satoshi Itō viewed the advancing tsunami. The hotel is preserved in its post-tsunami state as a visitor centre, memorial, and warning.
Sanriku is a known tsunami disaster zone. Despite efforts to discourage settlement in vulnerable locations, regular disaster drills, and the construction of massive concrete coastal defence infrastructure, loss of life occurs repeatedly when tsunami strike. Indeed, humanity has yet to prove capable of defending against tsunami of the size and power that struck Tōhoku on 11 March 2011. The disaster was notable due to many towns having constructed advanced sea defences, which may have provided a false sense of security, since all but those in Fudai were either destroyed or damaged (Furuta & Seino, 2016; Onishi, 2011). Stretching from northern Iwate to the Ōtsuchi Peninsula in Miyagi, the ria topography itself contributes to disaster severity by funnelling advancing tsunami, raising their height and amplifying their power (Hayashi, 2012).
Tarō was its own municipality until 2005, when it and neighbouring Niisato Village were absorbed into Miyako City under the ‘Heisei gappei’ municipal mergers.8 The population of Tarō has been reduced by more than half since the 1960s, with accelerating ageing and depopulation (Figure 1). Miyako too is shrinking, losing more than a quarter since 1960. Tarō shows the classic characteristics of Japan’s shrinking regions, and the recent acceleration in depopulation is not only due to the tsunami but the town’s increasing death rate as ageing intensifies, a decreasing birth rate as the number of adults of child-bearing age declines and low fertility continues,9 and out-migration by younger adults seeking educational, employment, and social opportunities in urban areas (See: Matanle, 2006; Matanle & Rausch et al, 2011; MIC, 2018). Significantly, in 2008 the Japanese population as a whole began shrinking, rendering expectations for growth in Tarō unrealistic, and post-tsunami long-term reconstruction planning challenging; since under a conventional reconstruction scenario new housing and infrastructure may in future decades become underutilised as the town continues to shrink.

Older people are especially vulnerable to disasters (McMillan, 2014; Ngo, 2012). During Hurricane Katrina in New Orleans and the Gulf coast nursing home residents were unable to evacuate independently and triage protocols prevented treatment for chronic conditions. There, 71% of deceased victims were over 60 years old and 47% over 75, exceeding their 15% of the resident population (Klein and Nagel, 2007). Similarly, in 2010, 30.9% of Miyako’s and 33.0% of Tarō’s populations were aged 65 or over, comfortably qualifying as hyper-aged communities, defined as 21% or more of the population over 65 (Coulmas, 2007: 5). In Tōhoku, of the 13,135 people assigned a cause of death by 11 April 2011, 65.2% were 60 or over and 92.5% had drowned (Japan Times, 2011). Mainly for mobility reasons many older people were unable to reach safety and we can assume that many disabled – who are often older – also fell victim. Tarō and other hyper-aged communities in coastal Tōhoku are therefore especially vulnerable to tsunami.
Ageing and depopulation are global phenomena, and Japan is in the vanguard in Asia. Indeed, nearly half of the world’s countries are now experiencing below-replacement fertility, and more than 30 countries have shrinking populations (GBD 2017 Causes of Death Collaborators, 2018). China, South Korea, and Taiwan are rapidly ageing and expect to begin depopulating soon. Even relatively youthful Anglophone societies with higher rates of immigration such as New Zealand are experiencing ageing and depopulation processes sub-nationally and in disaster prone areas (Jackson and Brabyn, 2017; Jackson and Felmingham, 2002; McMillan, 2014). All these countries are located on the Pacific Ring of Fire and experience frequent tectonic events. Beyond building resilience at home, therefore, Japan’s significance lies in how disasters and their human responses inform other countries as they enter their own post-growth pathways, particularly in disaster-prone regions of East and Southeast Asia (Matanle, 2013). Then there is climate change and its transformative contribution to the dynamics of human-environmental interactions.

NOAA (2019)10 lists 134 known fatal11 tsunami in Iwate since the Mw8.6 Jōgan earthquake in 869CE, which killed an estimated 1,000 people. Of these, 85 had parent earthquakes in the Japan Trench. Eleven of the most powerful are shown in Figure 2. Among NOAA’s listed tsunami, 17 note runup occurring at Tarō, beginning with the 1611CE Mw8.1 Keichō Sanriku earthquake, whose tsunami advanced 1.2km inland with a maximum run-up of 25m, and killed approximately 5,000 people nationwide (NOAA, 2019). This earthquake occurred six years after the Keichō Nankaidō earthquake, whose tsunami killed more than 5,000 people in central Honshu, and just two and a half months after the Aizu earthquake, which killed approximately 3,700 people in central Tōhoku. The unpredictability of earthquakes is underlined by Smits (2014) in his detailed history of earthquakes in Japan, and reinforced by Lay (2015), who demonstrates a surge in the number of great earthquakes worldwide in the decade 2004-14, by 265% compared to 1900-2004.
Hence, although earthquakes along the Japan Trench can occur in a regular sequence, unexpected combinations of events also occur. Drawing on the example of 2011, which included a serious accident at the Fukushima Daiichi nuclear power plant, in the 21st century it is reasonable to assume that powerful earthquakes and tsunami are likely to intersect with other risk vectors – climate change and industrial infrastructure – to generate compound techno-environmental events of great complexity and severity (Matanle, 2011).
Of the 27,122 people killed in the 1896 Meiji Sanriku tsunami, Tarō lost 1,867, or 83.1% of the town’s population, and all registered buildings were destroyed (Table 2) (Yamashita, 2003; Hayashi 2012). The 1933 Shōwa Sanriku tsunami also had a devastating impact, destroying 500 of 559 buildings, and killing 32% of Tarō’s 2,773 population (Yamashita, 2003). Hence, in 1934 the townspeople began to build a huge defensive seawall.

Completed in 1978, Tarō’s pre-2011 physical tsunami defence infrastructure was mainly comprised of three walls forming an X shape (Figure 3). This was in addition to port breakwaters and a bank of concrete tetrapods at the mouth of the ria facing east towards the Japan Trench for advance protection (Figure 3; Photo 1). In total 2,433m of seawall at a height of 10.0-13.7m was constructed between 1934 and 1978, forming what was considered the most comprehensive tsunami barrier in Japan; this was superseded in 2009 by the world’s deepest breakwater at Kamaishi (USD1.5 billion), which also failed in 2011 (Ogasawara and Sakai, 2012; Yamashita, 2003).
Due to their overwhelming stature dominating the surrounding town, Tarō’s seawalls became known as the Nihon no Banri no Chōjō [The Great Wall of Japan] (Nikkei, 2011), and the town earned the nickname Tsunami Tarō [Tsunami Boy] (Inoue, 2013). On the seventieth anniversary of the Shōwa Sanriku tsunami in 2003, Tarō Town Office published its ‘Tsunami Prevention Town Declaration’ (Tsunami bōsai no machi sengen), which described the walls as a symbol of the resilience of Tarō in defending against tsunami (Yamashita, 2003). The declaration acknowledged the fear unleashed, and declared the walls representing the townspeople’s defiant courage (chōsen suru yūki) (Photo 2). Though the walls became symbolic of Tarō’s identity and pride, in 2011 they did not protect the town as effectively as those who drafted the declaration had hoped (Figures 3 & 4).


Prior to the construction of Tarō’s pre-2011 walls the two most destructive recent tsunami had been the 14.6m Meiji Sanriku and 10.1m Showa Sanriku tsunami (Hayashi, 2012). Subsequent to beginning construction, four tsunami had struck Tarō between 1934 and 2011, causing minimal damage (Hayashi, 2012; Inoue, 2013). This included the 1960 Mw9.5 Valdivia earthquake near Chile, whose tsunami killed 53 people in Ōfunato and 41 in Minamisanriku, Iwate. Since the walls prevented damage from relatively common smaller tsunami, they were assumed to be sufficient.
The Failure of Tarō’s Seawalls
Shortly after 3.00pm on 11 March 2011 the tsunami broke through the tetrapods, destroyed the port breakwaters, and overcame all three seawalls, demolishing the newer second seawall (Figures 3 & 4 – Area D), killing 166 people and demolishing 979 buildings. The tsunami’s officially recorded height in Tarō was 15.75m, 1.1m higher than in 1896, and around 5.3m higher than the existing seawalls. The Tarō Fishing Cooperative’s port tower registers the tsunami reaching 17.3m (Photo 3), or 6.9m higher than the wall. The first wall survived structurally intact; but massive overtopping caused damage to buildings behind (Figures 3 & 4 – Area A).
The main reason for the infrastructure failure was over-confidence in predicting the maximum magnitude of future earthquakes as well as the height and strength of associated tsunami. Seventy-four per cent of seawalls in Tōhoku were built on assumptions of an Mw8 earthquake triggered tsunami, not the Mw9.0 quake of 2011 (Cyranoski, 2012). Despite this, Davis et al (2012) suggest that 3/11 was a ‘missed opportunity’ for disaster preparedness, because a powerful undersea quake with a giant tsunami occurring within the foreseeable future had been anticipated. In 2001, they had identified with a 70% certainty that an Mw8+ earthquake would occur. Furthermore, Satake et al (2007) assumed a 99% probability of an Mw8.1-8.3 earthquake occurring within 30 years. Neither of these studies, however, anticipated the Mw9.0+ event. Indeed, Smits (2014: 22-23) argues that the change from using the Richter scale to moment magnitude as a method for measuring earthquake strength from the late-1970s onwards, and historical earthquakes’ subsequent re-classification, may in part have contributed to the lack of studies predicting a Mw9.0+ earthquake for the Japan Trench region.
Secondly, initial warnings underestimated the tsunami’s size (Nakahara, 2011) (Table 3), and residents’ behavior during the preceding minutes suggests the seawalls gave a false sense of security. Three minutes after the earthquake, Iwate Prefecture announced a 3m+ tsunami warning. This was standard for Mw8.0+ earthquakes and, according to drills, residents should have evacuated. Then, 44 minutes after the earthquake, the announced height was upgraded to 10m+ . Possibly this did not provide enough evacuation time for some of those who had been slow respond to the initial warning. Significantly, the Japan Meteorological Association’s observed wave heights were recorded using floating buoys, some of which ceased data collection, having been damaged by the very tsunami they were designed to measure (Ozaki, 2011).

Thirdly, eyewitness Itō Satoshi, owner of the Tarō Kankō Hotel, who observed the tsunami from the fourth floor of his hotel (Photo 4), recounts people milling around behind the walls, apparently unaware of the danger, despite broadcasted warnings. He suggested that, although they had felt the earthquake, the high walls prevented them from seeing the approaching wave, nor were they rushing to evacuate due to their sense of safety behind the walls. Itō called out to warn them and filmed the wave. According to Itō, the areas immediately behind the seawalls had the highest mortality, compared to other areas where people had seen the advancing wave and quickly moved to higher ground along evacuation routes (Shifleen, 2015).
Although the proportion of casualties in 2011 was lower than in the two most serious recent tsunami, at 3.9% of the town’s population (Table 2), suggesting that the wall saved many lives, additional factors may also have contributed to reduced mortality.
- Advanced construction techniques using concrete and steel frames for new buildings.
- Retrofitting older buildings for earthquake safety.
- The population in 2011 had increased by 92% and 55% since 1896 and 1933, and there were 325% more buildings than in 1896. Many newer structures were located on higher ground inland of Zones A, B and C (Figures 3 & 4) and were unaffected.
- Tarō’s pre-2011 investment in soft-infrastructure was considerable (Yamashita, 2003). This included coastal forests; disaster radio, satellite receivers, and observation cameras; evacuation drills and disaster memorials; evacuation sites and routes; hosting a coastal municipality tsunami summit, etc.
Further, an alternative explanation is emerging from Tōhoku of the relative effectiveness of hard defence infrastructure. Aldrich (2019; Aldrich & Sawada, 2015) compared mortality for different communities along the entire coast of the three most affected prefectures and found that social capital stocks were a more significant predictor, and that differential mortality rates were also due to the pace of evacuation. Importantly, his research shows that social capital is also a better predictor for post-disaster survival and recovery, with communities possessing higher levels of capital recovering more rapidly (2019). Finally, the failure of seawall 2 (Figure 3) may have had a negative impact on survival. It is sensible to assume tsunami defences are more effective if they remain standing. The collapsing wall probably caused a water surge, much like a dam failure, accelerating the wave’s velocity and increasing its destructive power (Kanda, 2016).
Tarō’s experience with seawalls is significant because the townspeople’s decision to build what was considered long-term protection was in response to the 1896 and 1933 disasters and is a cautionary example for the post-2011 decision to build a comprehensive barrier along the coastline of Iwate, Miyagi, and Fukushima prefectures. Among the additional 100km of seawall nearing completion in Tōhoku, 49.5 km of which is over 10m in height, the new defences at Tarō will be 14.7m high (Reconstruction Agency, 2015), 2.6m lower than the height of the 2011 tsunami as measured on the Fishing Cooperative’s port tower. Assuming the continuation of current conditions and the successful experience of Fudai Village in 2011 with overtopping, the new seawall will likely save considerable life and damage. We now proceed to analysing the new defences and their emerging 21st century context.
Reconstructing Tarō and its Tsunami Defences
Tarō
On 1 June 2011 Miyako City began formulating its basic reconstruction plan and, after a series of open meetings on matters such as housing, education, health, transportation, and industry, presented a basic plan to citizens on 14 October. Citizens had four days to respond before the City Office finalised the plan on 31 October. Since then the City Office has regularly consulted residents about their reactions to current progress and delivery, though the extent to which citizen voices are genuinely incorporated into plans, or whether local authorities have sufficiently communicated their rationales to citizens, is contested.12 Indeed, residents in Tarō and along the Tōhoku coast expressed concern that they wanted a greater say in post-tsunami reconstruction planning, which is corroborated by Strusińska-Correia (2017).

Figure 5 shows a Google Earth image of Tarō taken on 9 January 2016 with the town’s basic reconstruction plan superimposed. Noteworthy aspects are:
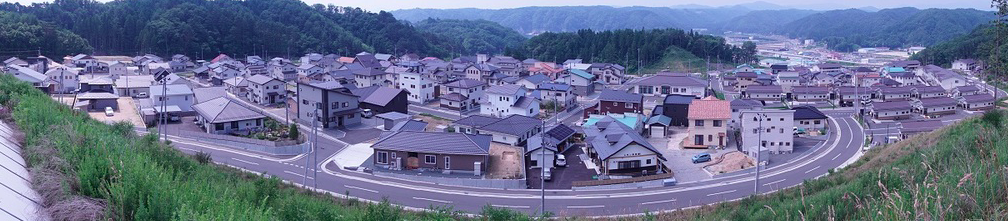
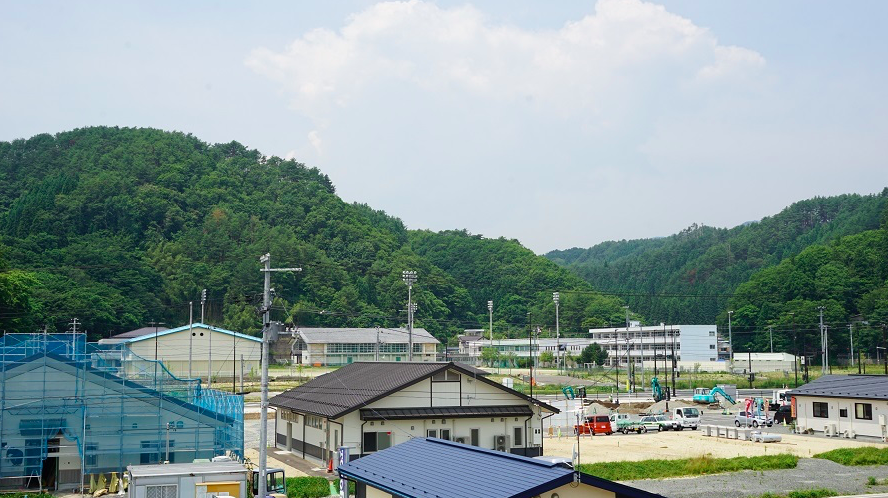
- Formerly forested mountainside located behind cliffs (north-east yellow) has been appropriated for housing and amenities, including a hospital (Photos 5 & 6).
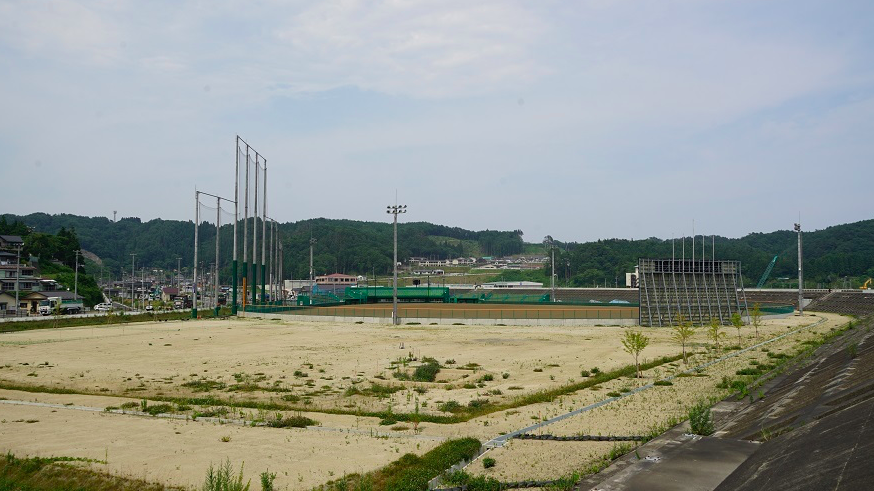
- A second residential housing zone is under construction to the north-west (yellow). Slightly higher than the port area, this is being raised by up to three metres. Some housing will be taller structures with rooftop evacuation. West of this (brown) will be a school, amenities, and park space doubling as an evacuation zone (Photo 7).
- A third residential zone is under construction in a forested mountainous area to the south, out of range of the image, and connected to the town by road. It too is protected by cliffs.
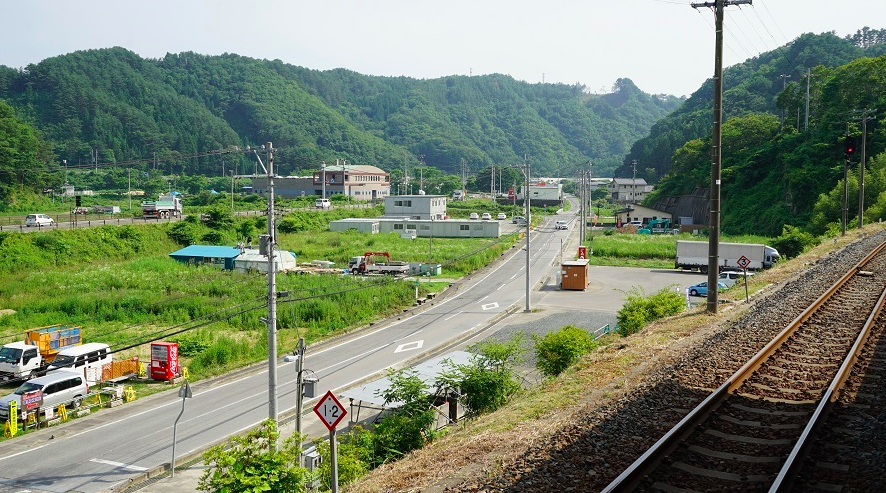
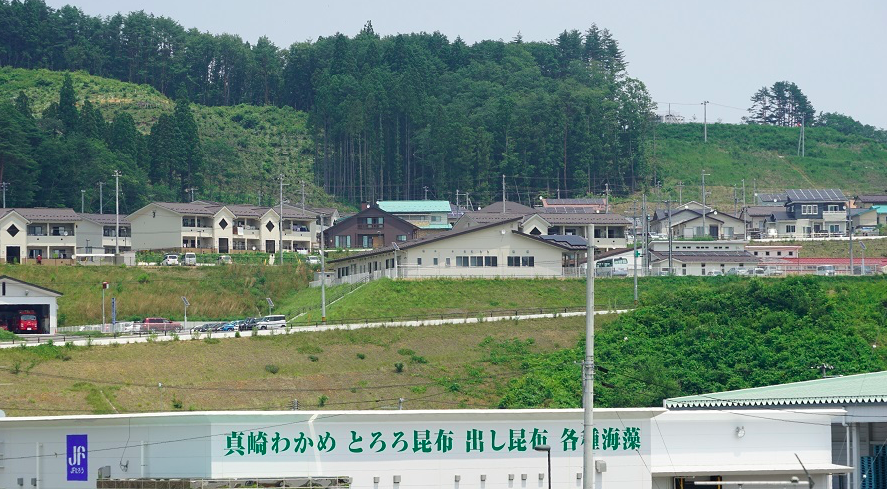
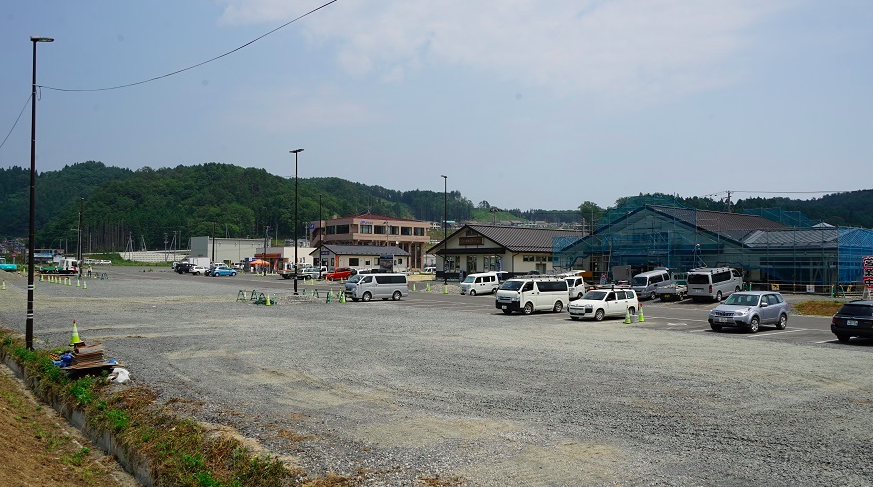
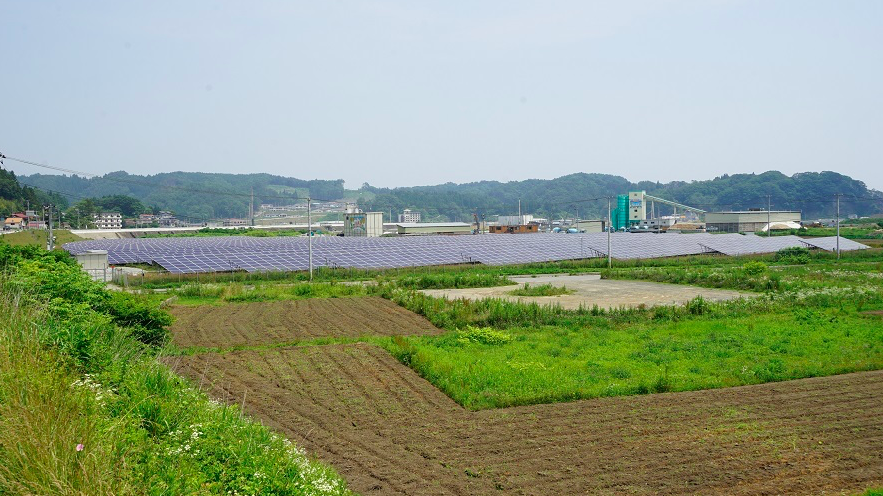
- Low-lying areas in the town centre are reserved for parks, sports pitches, amenities (brown; Photo 8), marine industrial and business facilities, a solar farm (purple; Photo 9), retail facilities (pink; Photo 10), and transportation (red, dotted lines; Photo 11). There will be no housing here and signposted evacuation routes are under construction.
- Areas along the river valley stretching westwards from the south will be a railway station zone (red); information and communications technology zone (purple); education zone around a senior high school (brown); and an agricultural zone (green). These areas are either on higher ground or located inland.
As the photos show, there is much to do and it is possible the plans are unrealistically costly in reconstructing what is already an ageing and shrinking community which in future decades, and in all likelihood, will not require all of the housing, services, and infrastructure being built under the present plans (Matanle, 2013).
Photos 5-11
Concrete seawalls are built for primary defence against storm surges, tsunami and coastal erosion, and may be used in conjunction with breakwaters, natural reefs, sand beaches, lagoons, forests, canals, levees, manmade banks, and road embankments (Tokida & Tanimoto, 2014; Koshimura et al, 2014). Built-up areas close to the coast often rely on a seawall alone, or a harbour with breakwaters. Tetrapods are also deployed either onshore or near-shore. Throughout Tōhoku on 3/11, including Tarō, each of these suffered damage or destruction (Mikami et al, 2012). Although Strusińska-Correia (2017) analyses the government’s overall tsunami defence strategy for Tōhoku in great detail, including mention of Tarō, it is worth reviewing this issue before proceeding to an analysis of the importance of addressing the challenges from the perspective of climate change.
Tarō’s Seawalls
Tokida and Tanimoto (2014) examined combined sea defences’ effectiveness, suggesting that the flow and force of the tsunami can be reduced most effectively with a seawall, forested embankment, and manmade canal. This incorporates the government’s new two-level tsunami classification system, introduced in response to the failure of 2011 (Kanda, 2016; MLIT, 2011; Raby et al, 2015; Shibayama et al, 2013). Level 1 events are considered tsunami protection events and assumed to occur every 50-60 to 150-160 years, with inundation depths of less than 7-10m. Level 2 are evacuation events of 10m+ inundation depth and assumed to occur every few hundred to a few thousand years apart. The 2011 tsunami is classified Level 2, resembling the 869CE Jōgan tsunami (Minoura et al, 2001; Shibayama et al, 2013).
Under this classification, post-2011 defences are designed to contain Level 1 events and allow Level 2 events to overtop walls without destroying them, as happened in Fudai in 2011, with overtopping seawater being collected in a land side canal running parallel (Raby et al, 2015). In addition, the specifications prevent land-side scouring caused by retreating waters pulling seaward, allowing subsequent waves to flow through destroyed defences. The wall’s slope is 2:1 on both sides, meaning a 10m wall, with a 3m flat top is altogether 43m across (Figure 6), which is devastating for sensitive coastal ecologies. Government literature addresses this but frames the choice as a question of positioning rather than expediency (Bird, 2013; MLIT, 2011; NACS-J, 2013). The original pre-2011 X-shaped walls constructed in Tarō closely resemble this design but were too small and lacked the land-side canal. Under these new recommendations the defences at Tarō are therefore being modified with an inner port wall of 14.7m and the original wall partially reconstructed and strengthened to a height of 10-12m (Photos 12-15; Miyako City, 2011), which will provide a base of more than 40m width. In addition, the harbor breakwaters and near-shore tetrapods are being strengthened, replaced and expanded in size and scope, giving the town four lines of concrete defence, as opposed to three in 2011. Concrete defences in Tōhoku have an anticipated effective lifespan of approximately 80-100 years, or until 2100-2120.

Photos 12-15 (July 2017). Click on the hyperlinks for a Google Earth view.
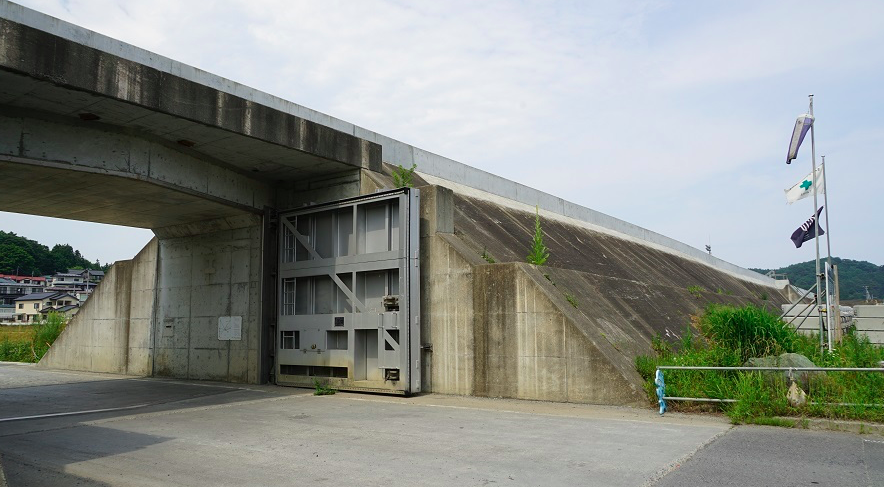
- Photo 12: Cross-sectional view through the central gate in the main seawall at Tarō. The lighter concrete atop the darker pre-2011 wall is a recent addition. Click here for a Google Earth view.
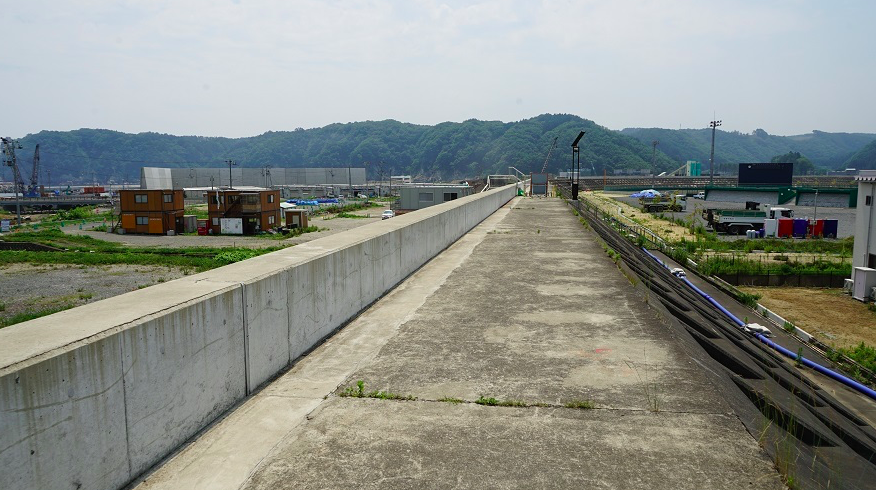
- Photo 13: Atop the main seawall, plus its landward slope.
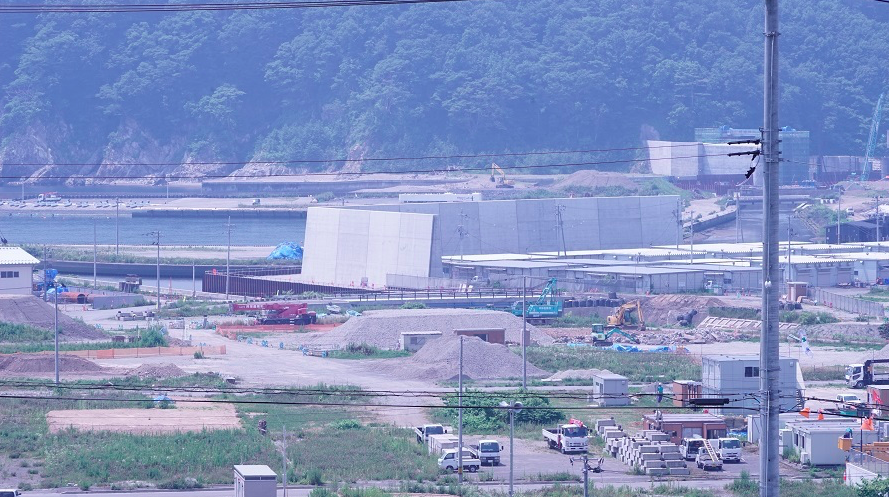
- Photo 14: The new internal breakwater under construction at the waterside fishing port zone.
- Photo 15: Taken from atop the main seawall, with debris from the wall’s destruction in 2011 still evident, showing that the internal breakwater will obscure ocean views from all sea level or near sea level locations in Tarō.
(Un)Imagining the Future? Climate Change and Tsunami Size
The reduction in Taro’s death rate from 83.9% of its population in 1896, through 32.5% in 1933, to 3.9% in 2011 (Table 2), indicates significant improvements in disaster risk reduction, and in combining physical sea defences with soft-infrastructure. Nevertheless, questions arise as to whether, by constructing defences to prevent a recurrence of the previous disaster, the authorities are adequately imagining and preparing for a changing future. Indeed, there is already evidence of a public trust deficit in the effectiveness of the reconstruction (Aldrich, 2017; Aldrich & Sawada, 2015; Bird, 2013; Strusińska-Correia, 2017).
In the aftermath of the 2011 disaster, the word sōteigai (‘beyond expectations’; ‘unimaginable’) was deployed by the government and Tokyo Electric Power Company to explain their failure to prevent the nuclear disaster (Samuels, 2013, 104). Significantly, the Japanese government acknowledges the relationship between anthropogenic climate change and rising sea levels. Japan is a member of the United Nations Framework Convention on Climate Change (UNFCCC), was host to COP3, which produced the Kyoto Protocol, and is signatory to the 2015 COP21 Paris Agreement, ratified into Japanese law on 8 November 2016 (UNFCCC, 2017), legally committing itself to climate mitigation and adaptation. Here we ask whether authorities are adequately ‘imagining’ the next tsunami.

Between 869 and 2017 an earthquake in the Japan Trench leading to a fatal tsunami in Iwate Prefecture has occurred on average every 104 years (Table 4). Five have resulted in more than 1,000 deaths, killing approximately 55,963 people; on average, they occurred every 296 years. However, the timing of the 1896, 1933 and 2011 tsunami shows that earthquakes involving mass fatalities are not temporally equidistant (See: Lay, 2015; Smits, 2014). Hence, while it could be argued the 2011 earthquake was unexpected, it was not unimaginable. It was the fourth most powerful on Earth since modern records began in 1900, came less than seven years after the Mw9.1 Indian Ocean earthquake whose tsunami killed nearly 230,000 people, and two other Mw9.0+ earthquakes have occurred in the Pacific Rim since 1960.13
Before 2011, Rahmstorf (2007) estimated sea level will rise 0.5-1.4m by 2100 compared with 1990 and warned that rises could be greater. Even so, estimates of the rate of sea level rise are regularly revised, usually upwards, as knowledge of ice sheet melting and analogous paleoclimatic conditions accumulates and scenario modelling improves. While disagreement remains over the rate of sea level rise, it is occurring, and likely more rapidly than at any period in the Earth’s history (Hansen, 2009). Indeed, IPCC AR4 estimated a global average rise of 0.18-0.59m by 2090-99 compared with 1980-99; seven years later AR5 estimates a rise of 0.26-0.82m by 2081–2100 relative to 1986–2005 (IPCC, 2007: 8; 2014: 13).
Some argue that IPCC projections are too cautious. Schaefer et al (2014) state that ‘[C]limate projections in … (AR5) … do not adequately account for emissions from thawing permafrost’. Hansen et al (2016) assert that a global average 2ºC surface temperature increase may result in rises ‘reaching several meters over a timescale of 50–150 years’, due to ‘amplifying feedback processes’; concluding that humanity is experiencing ‘a global emergency’ (2016: 3801). One of these is the potential for ice-cliff instability contributing more than a metre extra to current sea level rise predictions by 2100 (DeConto & Pollard, 2016). Furthermore, although the ‘Paris Agreement’s central aim is to … pursue efforts to limit the temperature increase even further to 1.5 degrees’ (UNFCCC, 2017), assessments of its achievability are pessimistic (Reilly et al, 2015; Rogelj et al, 2016). Recent studies confirm that ice-melt and sea level rise are accelerating (IMBIE Team, 2018; Nerem et al, 2018), and that IPCC projections underestimate future change.
The IPCC (2014) anticipates that current GHG emissions trajectories require significant coastal remodelling worldwide this century, and the Paris Agreement mandates adaptation and mitigation into national laws (UNFCCC, 2017). In the USA this includes new infrastructure, land use modifications, and repair and retrofitting of coastal facilities (EPA, 2017). Recently adaptation there has begun to include nature-based features (NNBFs) within a mix of hard, soft, and green infrastructure (Hill, 2015; Bridges, 2015).14
Climate change adaptation is usually incremental. Hinkel et al’s (2018) research in six locations worldwide concurs with this in shorter timescales; and it is sensible to assume that ongoing incremental change may accumulate into a transformational adaptation. Nevertheless, where human systems may be suddenly overwhelmed, where longer timescales are involved, or where incrementalism is insufficient, transformational adaptation may be required. Kates et al (2012) argue that these ‘may be difficult to implement because of uncertainties about climate change risks and adaptation benefits, the high costs of transformational actions, and institutional and behavioural actions that tend to maintain existing resource systems and policies’; what Hinkel et al (2018) refer to as social conflicts, economic and financial barriers, and technological limits. They describe transformational adaptations as those ‘adopted at a much larger scale or intensity, those that are truly new to a particular region or resource system, and those that transform places and shift locations’, and they can be responsive or anticipatory. Moreover, they set two conditions for implementation; whether there is large vulnerability in certain regions, populations, or resource systems; and whether climate change threatens to overwhelm even robust human systems.
The eastern coast of Tōhoku fulfils Kates et al’s criteria for transformative adaptation. Ageing and depopulation are increasing community vulnerability and, because these settlements are permanently at risk from tsunami, climate change driven sea level rise has potential to contribute to suddenly overwhelming defence infrastructure. Consequently, it is reasonable to ask whether and how government planning anticipates sea level rise in settlement (re)construction in Tōhoku in preparation for the next giant tsunami.
We analysed 181 post-3/11 basic reconstruction plans, plus updates and supplementary documentation, from the websites of the Reconstruction Agency; Iwate, Miyagi and Fukushima Prefectures; and all 36 coastal municipalities in eastern Tōhoku (Table 5). Using NVivo 11 we coded for Japanese language terms and synonyms15 for climate change, global warming, greenhouse effect, sea level rise, seawall, and tidal breakwater, looking for mentions in combination to find whether authorities were incorporating climate change driven sea level rise into reconstruction planning.
We found one mention of climate change driven sea level rise in reference to protecting Matsushima Bay’s natural beauty and ecology. There were 96 mentions of global warming and synonyms in 19 documents, with the most numerous in Miyagi and Iwate Prefectures’ plans. None associated climate change with sea level rise, and there were no references to sea level rise as an additional hazard for tsunami defence infrastructure.

Although combined scenario modelling of sea level rise and tsunami risks is still rare, the scientific literature now takes it seriously. Gica and Reynolds (2012) demonstrate an increased risk of coastal inundation at Midway from combined sea level rise and Mw8+ tsunami occurring in the northwestern Pacific. And Ramanamurthy et al (2005: 1740) advise that:
… for long-term human settlement planning, safe elevations along with distances from the coast or vulnerability lines for human settlement, especially in low-lying areas need to be determined taking in to account other future probabilistics such as occurrence of epicentre of tsunamigenic earthquake … anticipated sea level rise due to global warming … etc.
Probabalistic Tsunami (Multi-)Hazard Assessment (PTHA) is an important development in disaster risk reduction science, with most studies appearing after the 2004 Indian Ocean tsunami. Its purpose is to understand tsunami hazard to inform risk reduction activities by generating hazard maps or curves which estimate ‘the probability of exceeding specific levels of tsunami intensity metrics (e.g., runup or maximum inundation heights) (Grezio et al, 2017: 1158). Despite some criticism of its validity (Mulargia, Stark & Geller, 2017; Stein, Geller & Liu, 2012), PTHA is widely used for tsunami defence planning because it is globally applicable to tsunami with differing generating sources and return periods, and can incorporate epistemic variation, such as forecasts for sea level rise (Grezio et al, 2017; Dall’Osso et al, 2014). Even so, ‘tsunami risk assessments have mostly failed to take in to consideration future sea level rise associated with enhanced anthropogenic climate change. As such, future tsunami may well be even worse than our current best estimates as inundation may change markedly as sea level rises’ (Dominey-Howes & Goff, 2013).
Although PTHA for eastern Tōhoku have been conducted for retrospective modelling and methodological development (Goda et al, 2015; De Risi & Goda, 2016) to date we are unable to locate studies where climate change driven sea level rise has been included as a risk variable. Moreover, four officials from the Reconstruction Agency confirmed in an interview that the government had not included climate change driven sea level rise among its variables for advising prefectures and local governments in Tōhoku on coastal defence infrastructure ‘because sea level is only rising very slowly’. This begs the question whether Japanese authorities should build estimates for sea level rise into their scenario modelling and/or reconstruction and tsunami resilience planning in Tōhoku.
Internationally, acknowledgement of climate change as an additional risk for tsunami vulnerability is increasing (See: Hinkel et al, 2018). For example, Dall’Osso et al (2014) suggest that Sydney’s ‘existing exposure to earthquake-generated tsunamis is relatively low but would increase significantly under higher sea level conditions caused by combinations of tide and/or sea level rise’. In New Zealand, Tonkin and Taylor Ltd.’s consultancy report for Wellington City Council (Tonkin & Taylor Ltd., 2013: 63) assumes increased risk exposure and that ‘[I]ncreased sea levels may also mean greater water depths closer to the shore that can increase near shore wave heights and may also modify tsunami impacts’ (2013: 10). In 2004 Otago Regional Council collected LiDAR data which ‘enabled a detailed hydrodynamic model study to be undertaken of the risk of tsunami and storm-related inundation for the entire region, including an assessment of the potential effects of future sea level rise’ (NZME, 2009: 15). Indeed, New Zealand’s government is moving from deterministic perspectives of disasters as single events, towards an approach that understands disasters within a dynamic system of sudden events and long-term processes (NZME, 2009). As an ageing and shrinking society prone to tsunami, Tōhoku suits this approach.
Among PTHA performed in regions in Asia with similar physical characteristics to Tōhoku that do include sea level rise, Li et al (2018) conducted 1,886 scenarios for Macao, which is vulnerable to tsunami generated by megathrust earthquakes originating in the Manila Trench. Their results indicate a sea level rise of ‘0.5m (by 2060) and 1m (by 2100) would dramatically increase the frequency of tsunami-induced flooding incidences by a factor of 1.2 to 2.4 and 1.5 to 4.7, respectively’. Li et al also found that ‘inundation depths increase significantly’, noting depths of up to ‘0.2 to 0.5m greater than the 0.5 and 1m increased sea level’. Their ‘worst case scenario’ modelled a Mw9.3 rupture across three earthquake zones along the Manila Trench, describing its similarity to the 2011 Tōhoku earthquake, showing extensive inundation. Finally, Li et al emphasise that they use conservative estimates for sea level rise – that current research suggests a 1.5m rise by 2100 for Macau – and that they used mean high-water as their tidal variable, stressing that coastlines with a larger tidal range might have a vulnerability greater than their scenarios suggest. The ria coastline of Iwate Prefecture is one such coastline.
The Tarō Fishing Cooperative’s port tower measures the Shōwa Sanriku, Meiji Sanriku, and 2011 tsunami at 10.0, 15.0, and 17.3m. Tarō has therefore experienced two, possibly three, Level 2 tsunami causing mass fatalities within 124 years. The Japanese authorities have not included estimates for the effects of climate change on sea levels and future tsunami height and frequency, despite scientific research emerging that sea level rise places coastal communities at elevated risk. It is possible that, not only will Tarō experience an increased incidence of tsunami, including Level 2 tsunami, within the next 50-100 years, but that earthquakes which in the past would have caused a Level 1 tsunami of 7-10m may in future create Level 2 events greater than 10m. In turn, Level 2 tsunami likely may be higher than current estimates for safe overtopping of sea defences, increasing the risk of a repeat of 2011 when the majority of tsunami defence infrastructure was ineffective, with disastrous consequences for vulnerable ageing and shrinking communities like Tarō. Using Li et al (2018) and the Tarō fishing cooperative’s measures as a base, it is possible to anticipate that a Mw9.0 earthquake as occurred in 2011, with the addition of 1.5m in sea level within the next 100 years, would generate a 19+ m Tsunami in Tarō, overtopping the highest point of the new sea defences by more than 4m.
Concluding Discussion
The defences nearing completion in Tarō are stronger than previously. In the event of a Level 1 tsunami they will likely prevent considerable damage and save lives. Tarō’s new layout is also safer and some transformational adaptation to living space is being implemented, but this is not in response to climate change. Notwithstanding, we have shown that it is not unimaginable for sea level to rise such that some Level 1 tsunami events will become Level 2, and for Level 2 events to become large enough potentially to overwhelm defences, just as the ‘unimaginable’ tsunami of 11 March 2011 overwhelmed what were then the strongest defences ever built in Tarō and Kamaishi. Consequently, we argue that the government’s rationale for the construction of the wall is potentially insufficient, given the accumulated risks of another powerful undersea earthquake occurring in the region, global warming driven sea level rise changing the dynamics of tsunami in unpredictable ways, and coastal communities will be considerably different in their size and composition in the decades to come. Nevertheless, important though the social capital perspective is in demanding the development of systems of mutual aid in local communities at risk of disaster, it is necessarily one part of implementing a disaster prevention strategy that responds to the whole spectrum of risks involv


