Select date

From Less-Splendid Housing Bubbles to Crushed Markets in America, August Update


by Wolf Richter, Wolf Street:
![]() Chicago condo prices stall. Dallas boom slows. Minneapolis, Charlotte, Atlanta zoom higher. Detroit prices up 100% from 2012! Cleveland struggles.
Chicago condo prices stall. Dallas boom slows. Minneapolis, Charlotte, Atlanta zoom higher. Detroit prices up 100% from 2012! Cleveland struggles.
I have cut the US housing market in two: The Most Splendid Housing Bubbles in America, where home prices have more than doubled at some point since January 2000; and the rest of the markets that make up the CoreLogic Case-Shiller Home Price Index, where prices have not yet doubled since January 2000, which includes some markets that had been totally crushed.
Chicago Home Prices:
In the huge and diverse Chicago metro, prices of single-family houses, according to the Case-Shiller Index, rose 0.7% in June from May, about in line with seasonal upticks at this time of the year, which left the index up 1.5% from June last year, but still down 13% from the nutty peak during Housing Bubble 1:
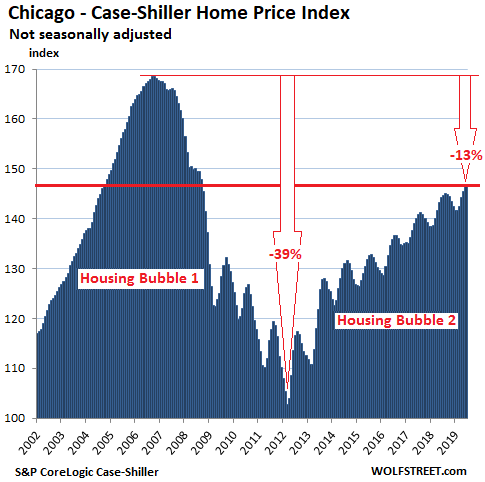
The charts here – except those for Dallas-Fort Worth, Minneapolis, and Detroit – are on the same scale, based on the Chicago chart above, with the vertical axis going from 100 to 170, which fits Chicago’s Housing Bubble 1. The Case-Shiller Index was set at 100 for January 2000. Chicago’s peak index value of 169 during Housing Bubble 1 means that house prices had risen 69% from January 2000 to September 2006. The index value for June 2019 of 146 indicates that house prices have risen 46% since January 2000.
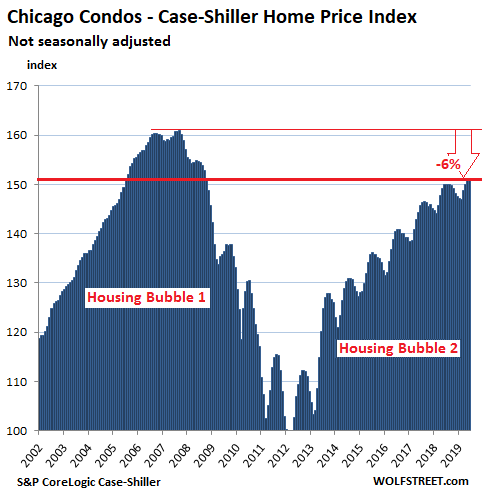
Condo prices in the Chicago metro were flat in June, compared to May (-0.04%), whittling down the year-over-year gain to just 0.8%:
Dallas-Fort Worth House Prices:
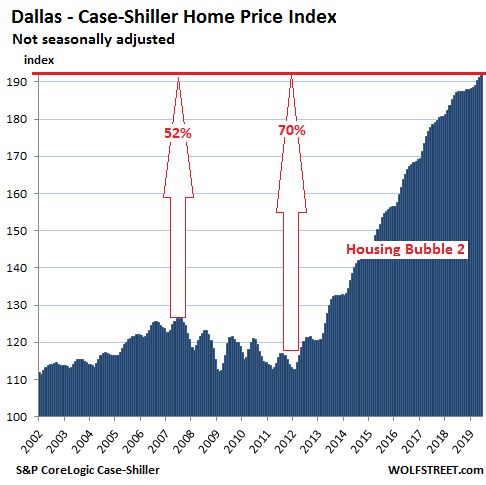
The Dallas-Fort Worth metro missed Housing Bubble 1, and so it missed Housing Bust 1. But it has been party time ever since, with a housing bubble of historic proportion: Between January 2012 and June 2019, the Case-Shiller index has skyrocketed 70%! But over the last few months, the pace of the increases has slowed. In June, the index ticked up 0.4% from May. Compared to June 2018, the index has risen 2.7%, on par with the prior two months, but the slowest pace since March 2012:
Minneapolis house prices:
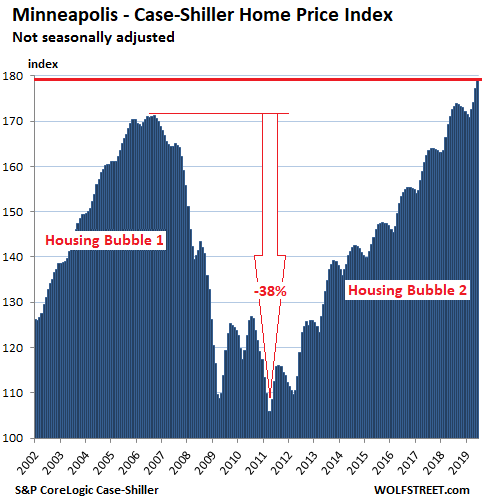
The Case-Shiller Index for the Minneapolis metro rose 1.1% in June from May, and 3.9% from June 2018. Housing Bubble 1 and Housing Bust 1 were similar in Chicago and Minneapolis, but the metros have diverged since, with house prices in Minneapolis having risen 4.7% above the peak of Housing Bubble 1 while Chicago’s prices are still 13% below the peak:
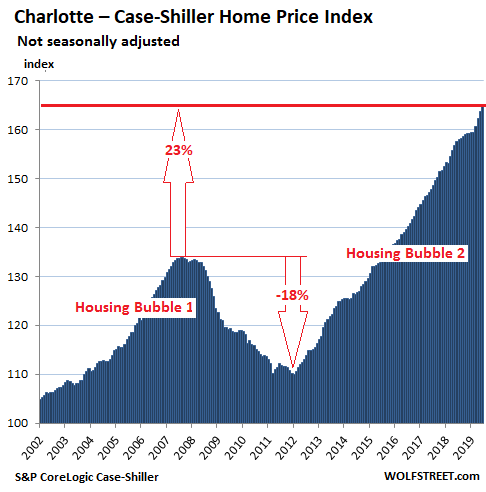
Charlotte house prices:
House prices in the Charlotte metro ticked up 0.6% in June from May, and rose 4.5% from June last year, to a new record, continuing a relentless push higher that started in early 2012 and hasn’t abated since:
Atlanta house prices:
House prices in the Atlanta metro ticked up 0.5% in June from May, and rose 4.5% from June last year, to a new record. During Housing Bust 1, the Case-Shiller index had plunged 40% to an index value of 82.5 by early 2012, where it had first been in 1996. The chart is on the same scale as the charts for Chicago; note the larger amount of white space. Nevertheless, since January 2000, house prices according to the index have soared 53%:
Loading...


