Select date

How Central Banks Lost Control Of The Market, In One Chart


 By Tyler Durden
The topic of this year’s Jackson Hole was, in not so many words, the fading power of central banks which for the past decade, had been the only game in town. However, with interest rates back to record lows, and the ECB (and soon Fed) set to restart QE, the outcome will be even worse than last time, sending the world into Albert Edwards’ infamous deflationary ice age.
But one didn’t have to go all the way to Wyoming to observe the waning power of central banks. A quick look at the following chart from Bank of America would have sufficed.
As BofA’s equity derivatives team led by Stefano Pascale and Benjamin Bowler notes, the year 2018 was characterized by the awakening of vol from 2017’s historical lows as investors adjusted to CBs showing less sensitivity for markets.
Meanwhile, Bank of America’s buy-the-dip rule, which worked 9 out 11 times from 2013-2017 when central banks were in their prime, failed 4 times in 2018, and only after the ~20% selloff of Q4 did the Fed flip to a much more dovish rhetoric.
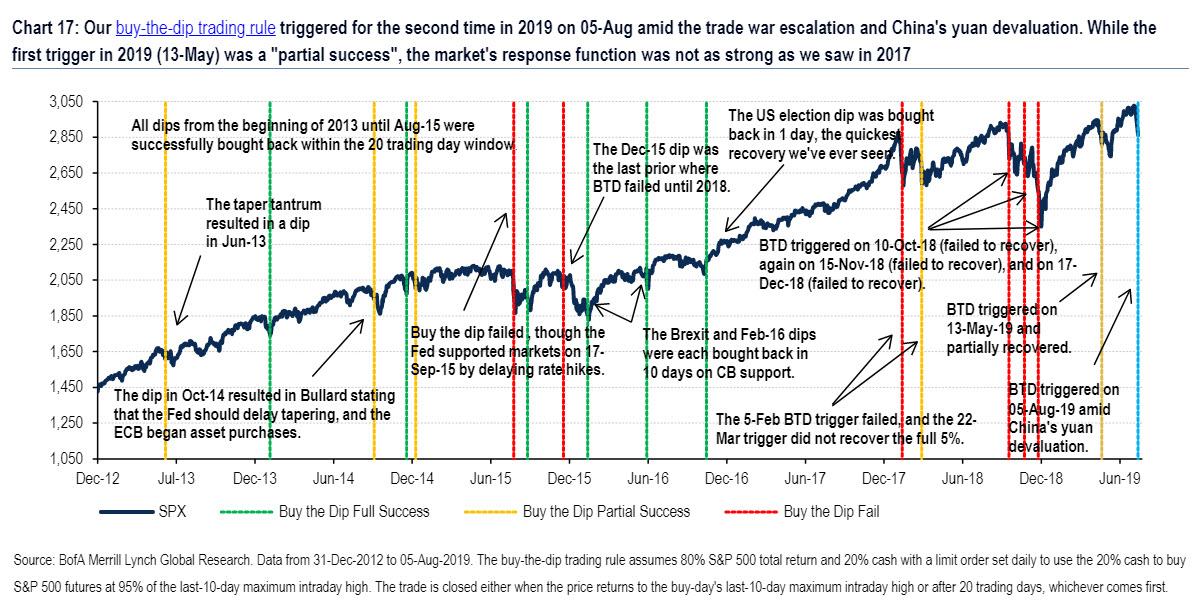
This historical U-turn led to a record start to 2019 for risk assets and one of the sharpest drops in cross-asset vol ever. However, an ominous, if 30,000 ft. view shows that, despite CBs’ best efforts to contain risk this year, the genie can’t be put back in the bottle, and cross-asset vol is unlikely to return to 2017 bubble-lows.
This is shown best through the lens of Bank of America’s GFSI Market Risk indicator, which despite virtually every central bank turning dovish in 2019, is unchanged on average between 2018 and 2019. Indeed, among its cross-asset components and including credit spreads, rates and commodity vol are on average markedly higher in ’19 than in ’18 (less negative numbers indicating higher vol), FX vol has hit new lows this year, and equities and credit are showing similar levels of stress.
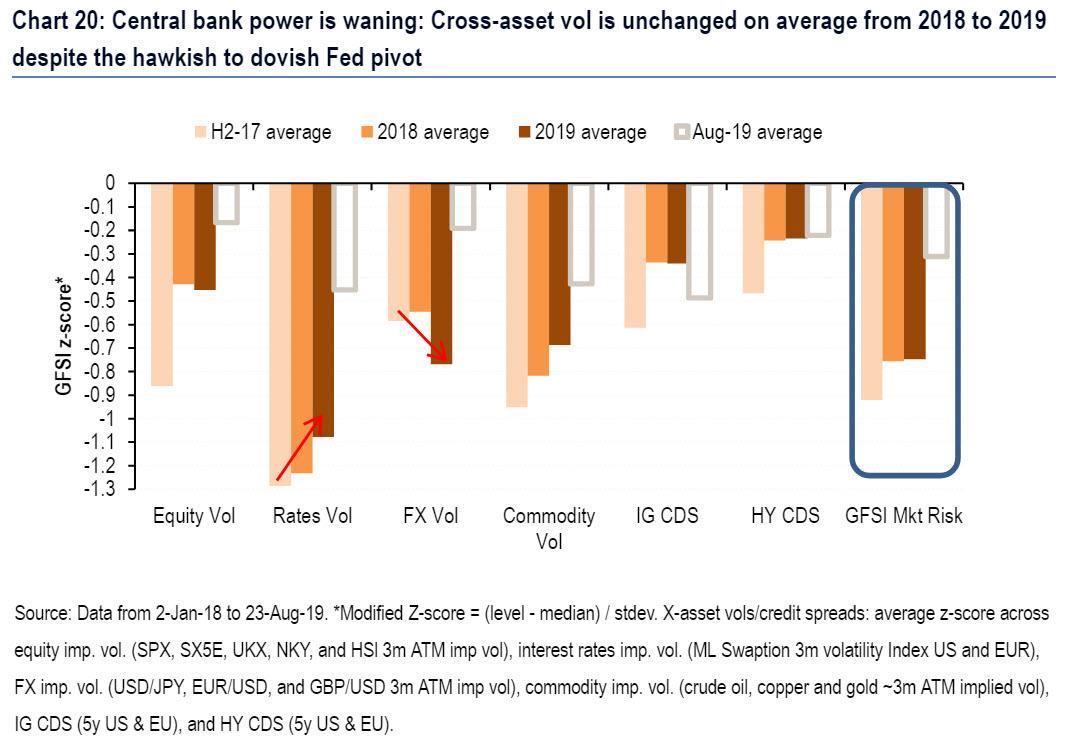
Why is this notable? Because as the BofA strategists conclude, “this is important evidence that the market’s trust in central bank support is waning and that the 2017 ultra-low levels of vol are probably behind us.”
The bigger problem, as Jackson Hole demonstrated and as Bill Dudley’s subsequent op-ed confirmed, is that central bankers’ trust in themselves is collapsing, to the point where they are engaging in irrational, panicked actions and unsure what to do when the next recession inevitably hits. Which is why all they can do is delay the inevitable downturn by preventing the S&P from sliding back to its fair value for as long as they can.
This article was sourced from ZeroHedge.com
Subscribe to Activist Post for truth, peace, and freedom news. Follow us on Minds, Twitter, Steemit, and SoMee. Become an Activist Post Patron for as little as $1 per month.
Provide, Protect and Profit from what’s coming! Get a free issue of Counter Markets today.

