Select date

Chinese gold imports – Better data, lower inflows, unanswered questions


by Ronan Manly, BullionStar:
In mid-August Reuters published a story titled ”China curbs gold imports as trade war heats up” claiming that the Chinese authorities had been ”severely restricting gold imports since May” by reducing the monthly gold import quotas that are handed out to a group of Chinese and foreign banks by China’s central bank, the People’s bank of China (PBoC). The background to gold import quotas can be read here in BullionStar’s article “Chinese Cross-Border Trade Rules on Gold“.
Speaking on condition of anonymity
Reuters said it had verified its claims by talking to seven unidentified ”sources in the bullion industry in London, Hong Kong, Singapore and China”, who in summary had said that ”quotas have been curtailed or not granted at all for several months”. According to the Reuters sources quoted, “there are virtually no import quotas now issued in China” and “next to nothing was imported by banks in June and July”. Quite dramatic if true.
These sources also speculated that the motive for the claimed gold import quota restrictions was to ”help limit the amount of money leaving the country amid a plunge in the value of the yuan”.
A week later on 22 August, Reuters published a follow-up article titled ”China eases restrictions on gold imports: sources”, claiming that its bullion industry sources, which by then consisted of ‘three people with direct knowledge of the matter in London and Asia”, were now saying that the PBoC had ”began to issue quotas again last week” but that these quotas were ”less than usual”. According to one of the sources ”some [gold import] quotas have been given”. According to another source, there had been a ”partial lift” of the quota restrictions.
Coincidentally, or even bizarrely as regards timing, the Reuters stories suggest that in the very week that Reuters claims the Chinese authorities were restricting gold import quotas, i.e. the week of 12 – 16 August, the very same Chinese authorities then decided to lift said gold import quota restrictions. Be that as it may, but there is a troubling feature of mainstream financial media articles such as these Reuters articles, and that is that it is impossible to verify the claims within the articles, for the very fact that the sources they use are not identified.
The use of unidentified sources, as Reuters seems so fond of using, begs the question, why? The answer, according to Reuters, is that these sources were ”speaking on condition of anonymity because they are not authorized to speak to the media”. So that’s ten sources in the bullion industry that Reuters used for its two articles, none of which are authorized to speak to the media, but all ten of which chose to breach their internal compliance rules and proceeded to speak to the media. Quite a record.
The 14 August Reuters story also contained the following quote about comparative Chinese gold import figures for various periods during 2019 and equivalent periods during 2018:
”Chinese customs figures show it imported 575 tonnes of gold in the first half of the year, down from 883 tonnes in the same period of 2018.
In May, China imported 71 tonnes, down from 157 tonnes in May 2018. In June, the last month for which data is available, the decline was even sharper, with 57 tonnes shipped compared with 199 tonnes in June last year.”
Running the Numbers
While we can’t verify the anonymous sources used by Reuters for obvious reasons, i.e. they are anonymous, we can however verify the import figures that Reuters quotes, using recently published Chinese gold import data. This is because in late 2018, Chinese customs authorities in quite an interesting move, began publishing granular monthly data of both China’s non-monetary gold imports and non-monetary gold exports. Non-monetary gold refers to any gold that is not central bank gold. Central bank gold (monetary gold) across the world gets an exemption from cross-border trade reporting. This is for the simple reason that central bankers do not want market transparency as it would, not surprisingly, reveal their real influence of the gold market. But that’s another story.
Back to non-monetary gold. The General Administration of Customs of the People’s Republic of China (GACC) now publishes gold import and export data on its website in a series of interactive tables in English, which can be found here. This covers gold imported into mainland China.
The gold that we are interested in here is covered by traded products code HS7108, which is ”gold unwrought or in semi-manufactured forms, or in powder form”. HS71081200, gold in unwrought form, is the main category imported into China. HS71081300, gold in other semi-manufactured form, is also relevant here, as its material in the total quantity of gold imported into China. HS71081100 is gold powder and is not really relevant to the analysis since its imported in very small quantities.
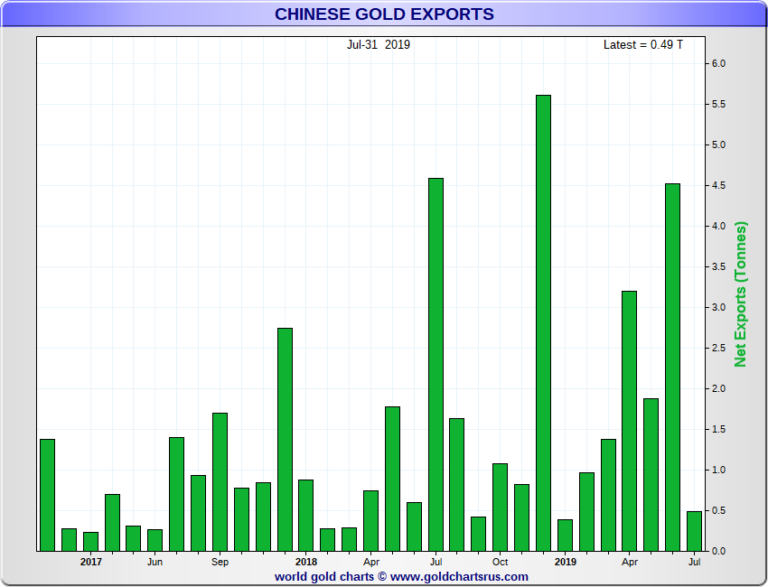
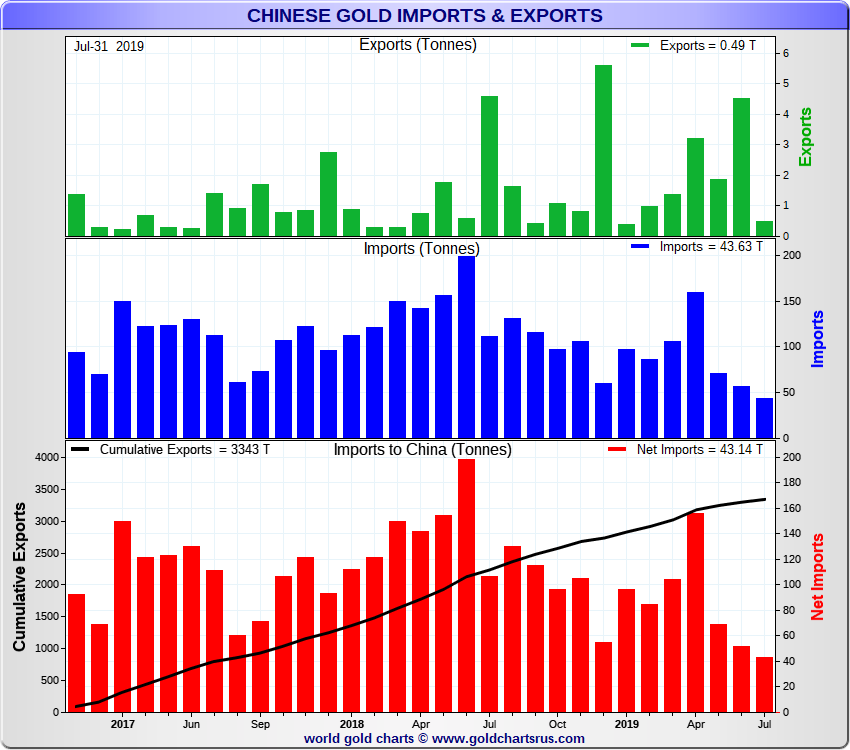
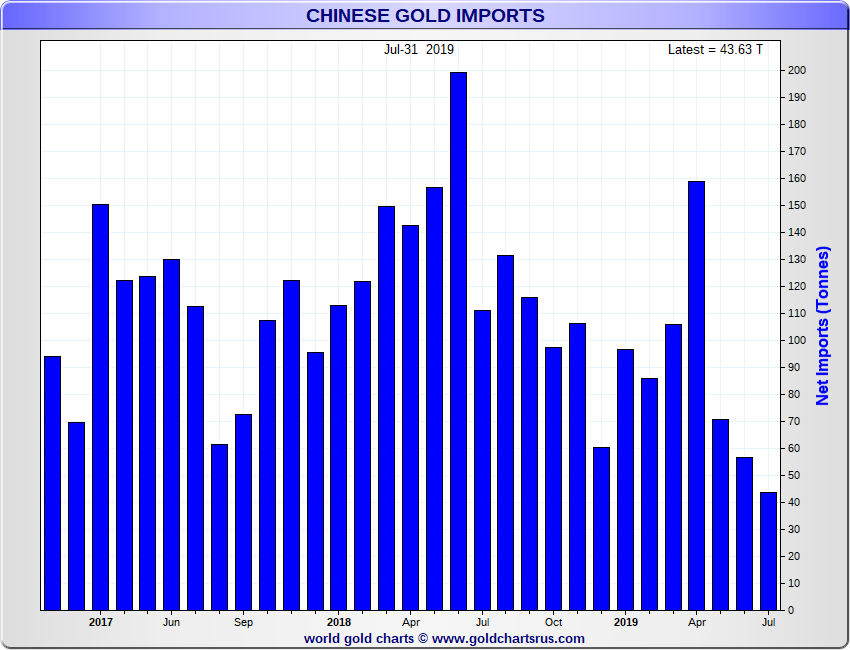
When Chinese customs began publishing monthly gold import in late 2018, it also retrospectively published all the monthly gold import figures for 2017 and 2018, so there are now, at the time of writing, 31 months of Chinese non-monetary gold import data available, i.e. from January 2017 to July 2019, data which is useful for month-to-month and year-to-year comparisons, and which allows the construction of the interesting charts featured here, created by Nick Laird of the unique GoldChartsRUs.com website.
Prior to this official Chinese gold import data being published, the quantity of gold being imported into China had to be estimated. At times this was done very accurately by the likes of Matt Turner of Maquarie Bank, who used various methods, including adding up the gold export figures of other countries to China – at least for those countries that published their gold export figures.
2018 – A Bumper Year for Gold Imports
Turner, in his commentary for the LBMA magazine earlier this year, was probably the first person to draw attention to this new official Chinese gold import data, but unfortunately he didn’t provide a link to the actual trade database. What he did find though was that:
”in 2017, according to the official data, China imported 1,270 tonnes of gold. In 2018, that rose to a huge 1,506 tonnes of gold. Almost all of this comes under the subcategory HS710812, which is unwrought gold, but there is a small amount of HS 710813 or semi-manufactured gold.”
Doing a quick spot check of Matt’s figures,and running some queries in the Chinese trade and customs database, my results say that 1262 tonnes of gold were imported into China during 2017. This is when you include HS codes 71081200 and 71081300. Matt Turner got 1270 tonnes for the same two HS codes. I am not sure why the 8 tonne difference, perhaps some data has been subsequently adjusted, but in the overall picture, it’s not material.
Turning to 2018, and using same two HS codes above, my query results say that 1505.7 tonnes of gold were imported during 2018. Matt Turner said 1506 tonnes, so that’s identical. Therefore, we can say that the data in this Chinese trade data database is that same as that used by Turner since it produces the same results over independent queries.
So how do the Reuters stories above stand up to the results from the newly revealed database? Recall again that the Reuters 14 August article, ”China curbs gold imports as trade war heats up”, states that:
”Chinese customs figures show it imported 575 tonnes of gold in the first half of the year, down from 883 tonnes in the same period of 2018.
In May, China imported 71 tonnes, down from 157 tonnes in May 2018. In June, the last month for which data is available, the decline was even sharper, with 57 tonnes shipped compared with 199 tonnes in June last year.”
Did Reuters get its data from the same customs and trade database? We can check. For the 6 months from January to June 2019, my query results of the trade database say that China imported 575 tonnes of gold. This tallies exactly with the Reuters figure of 575 tonnes for H1 2019. The H1 2018 Reuters figure of 883 tonnes also aligns perfectly since I get 883.17 tonnes when querying for the two relevant HS codes.
The May 2019 number from Reuters of 71 tonnes also checks out OK. I get 70.8 tonnes. As does the Reuters figure of 157 tonnes from May 2018. I get 156.8 tonnes. Similarly for June 2019, Reuters says 57 tonnes. I get 56.8 tonnes. For June 2018, Reuters says 199 tonnes, I get 199.3 tonnes. Therefore, we can say that Reuters is quoting its gold import figures from the same database that can be found here -> http://43.248.49.97/indexEn
Down but not Out
Now that the July 2019 data is in, we can see that 619 tonnes of non-monetary gold have been imported into China over the seven months of 2019 from January to July inclusive. Over the similar period in 2018, a total of 994 tonnes of gold were imported, and for the seven month period in 2017 the total was 802 tonnes.
Therefore, total gold imports over January – July 2019 are 37% lower than during January – July 2018, and 23% lower than during January – July 2017. But when breaking the seven month period down further into two periods from January to April and from May to July (the period in which the lower import quotas are said to have put into effect), that the drop is more startling.
Over January to April 2019, China imported 448 tonnes of gold. This was actually higher than the 436 tonnes of gold imported into China over January – April 2017, and not too far off the 527 tonnes of gold imported into the country over January – April 2018. But looking at the May – July period, China imported 366 tonnes over May -July 2017, 467 tonnes between May and July 2018, but only 171 tonnes over May -July 2019. In percentage terms, the 2019 May – July gold imports are 114% lower than the same period in 2017, and a whopping 173% lower than in the same period in 2018. So there is substance to what Reuters is reporting about lower gold imports into China since May.
Loading...


