Select date

Gold, Silver and Platinum surge ahead with impressive double digit YTD returns


by Torgny Persson, BullionStar:
The recent trading action of gold, silver and platinum on international markets has been nothing short of spectacular, with the spot prices of all three precious metals up strongly in recent months, and in the case of gold and silver, prices registering multi-year highs. Investors and savers in physical precious metals bars and coins have likewise seen increased values in their holdings.
In US dollar terms, gold is now up 20.73% year-to-date, silver is up 25.91%, and not to be left behind, the spot platinum price in US dollars is now up 22.25% year-to-date. All three metals are all still contenders for centre spot on the precious metals 2019 podium.
Although there is more to the global gold market than the US dollar, precious metals prices in US dollar terms are important to watch since the metals trade add are priced internationally in US dollars in the large trading venues around the which most influence precious metals price discovery.
Spot Gold in US dollars
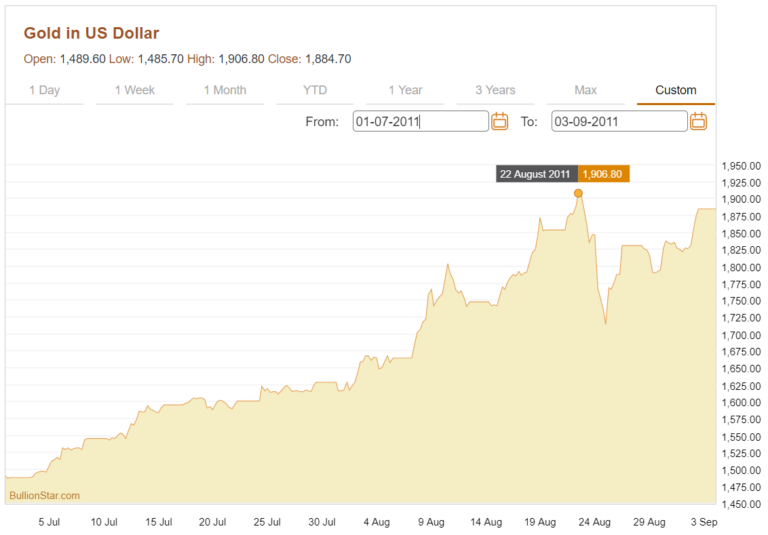
For nearly 6 years until June this year, the US dollar gold price had tried, but failed to break out above $1350, trading mostly in the $1100 to $1300 range with sporadic attempts to move towards $1350.
This all changed however, with a gold price move beginning at the start of June. By the third week of June, the US dollar gold price had risen up through the $1400 level, establishing a new trading level above $1400 and building a base above $1400 throughout July. The first week of August then saw the US dollar gold price rapidly through the $1500 level, ending the month at $1520.
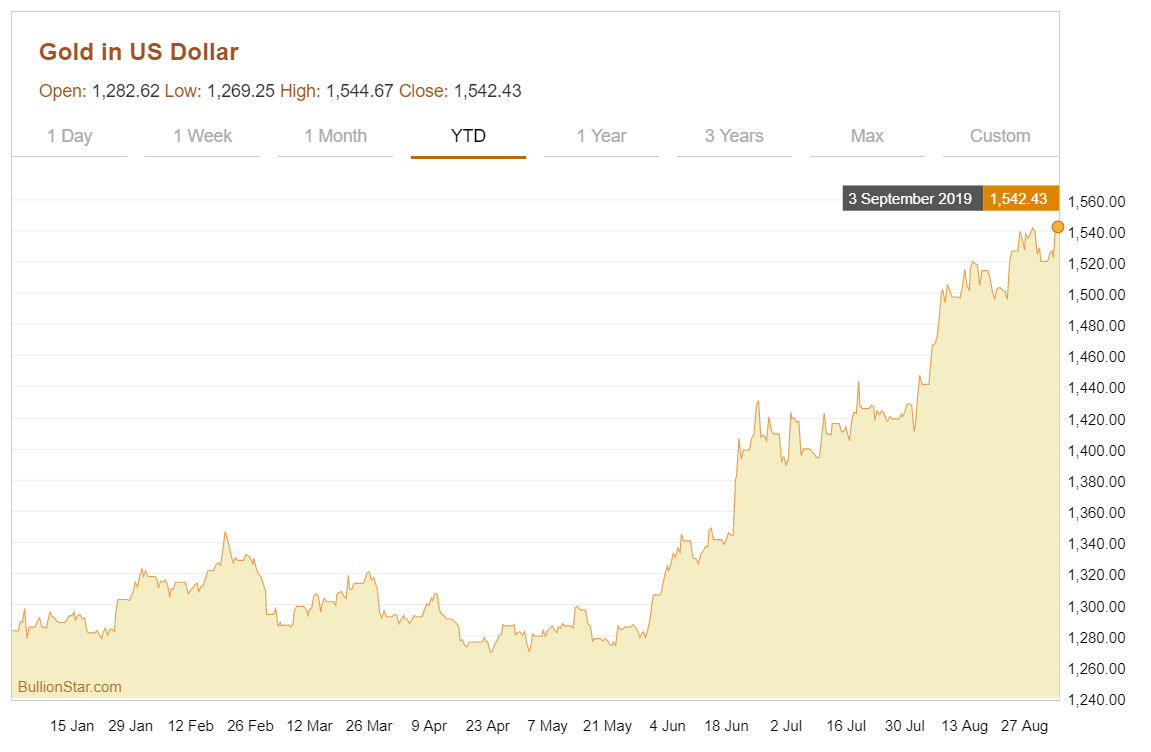
Overall, gold added 16.71% in the 3 months from June to August, mainly due to a 8.21% move up in June, and a 6.43% rise in August. At the time of writing in early September, gold has now risen 18.86% since the end of May and 20.67% year-to-date. Over 1 year, gold is up 29.06%. At its current level of $1547.69 (at the time of writing), gold in US dollars is near a six and a half year high.
Spot Silver on a Streak
The spot silver price in US dollars is now trading at $19.50 per troy ounce and approaching a 3-year high. It has not been this strong since mid September 2016.
Like, gold, silver’s recent strong ascent in US dollar price terms began at the end of May when the precious metal was trading at $14.5 per ounce. This was followed by a breach of the $15 level on the upside during June, then silver accelerated taking out $16 in mid-July, $17 in early August and $18 by end of August. At the time of writing, silver has now also comfortably taken out the $19 level and is halfway to $20.
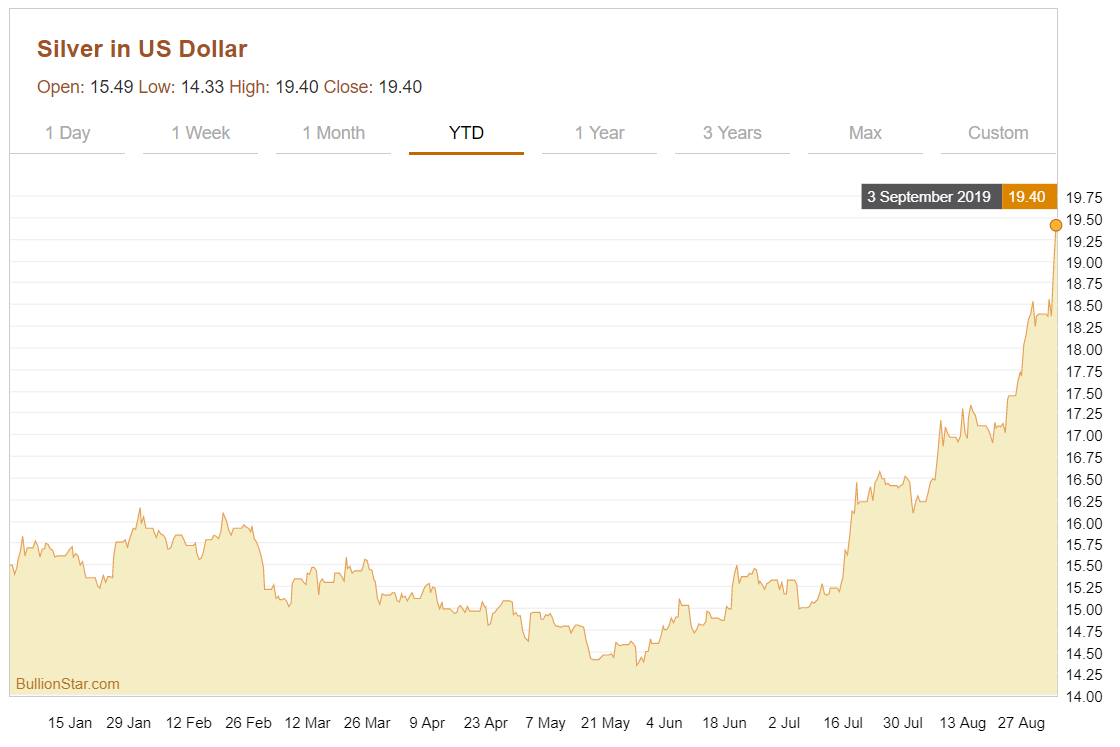
The 3 month period from June to August saw silver add 27% buoyed by a very strong August in which USD silver rose 12%, from $16.48 to $18.38. From 31 May to the time of writing, silver has now risen by 34%.
One year ago, silver was trading at $14.5 per ounce, the same as the end of May this year. The one year performance for USD silver is therefore also 34%. Year-to-date, spot silver has added 25.68%, and in the last month (from 03 August to 03 September) silver is up an impressive 20.04%.
Platinum – Later to the Party
The spot price of platinum in US dollars is now near a one and a half year high at $961 per ounce, having not been at this level since mid-March 2018. On a year-to-date basis, platinum is now up 22.25%, so is neck and neck with the year-to-date performance of gold and silver. All of the up move in platinum has happened since the end of May, with the spot price up 21.51% since 31 May.
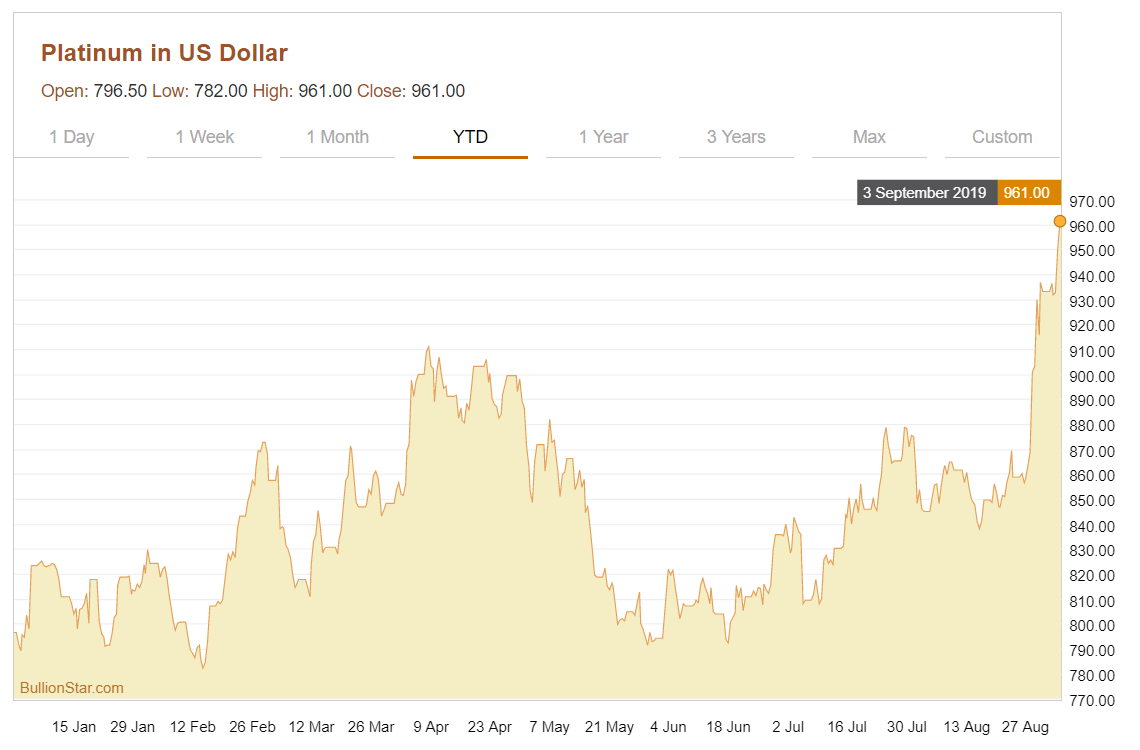
After rising nearly 9% over June and July combined, the white metal rose another 8% in August, and then pulled off a noticeable surge starting in the last few trading days of August and into September. In percentage terms, since 27 August, platinum is up a staggering 12.47%.
As the spot price of platinum one year ago is coincidentally the same as the price at the beginning of 2019, the one year price and year-to-date price rises of platinum are currently identical, i.e. 22.25%.
While the US gold price led the price surges across the three metals since early June, this awakened the prices of both silver and platinum, with silver’s price accelerating, month to month over June to August, e.g. the silver price rose 6% in June, 8% in July, 10% in August, and another 6% to 03 September, in platinum’s late August – early September rally.
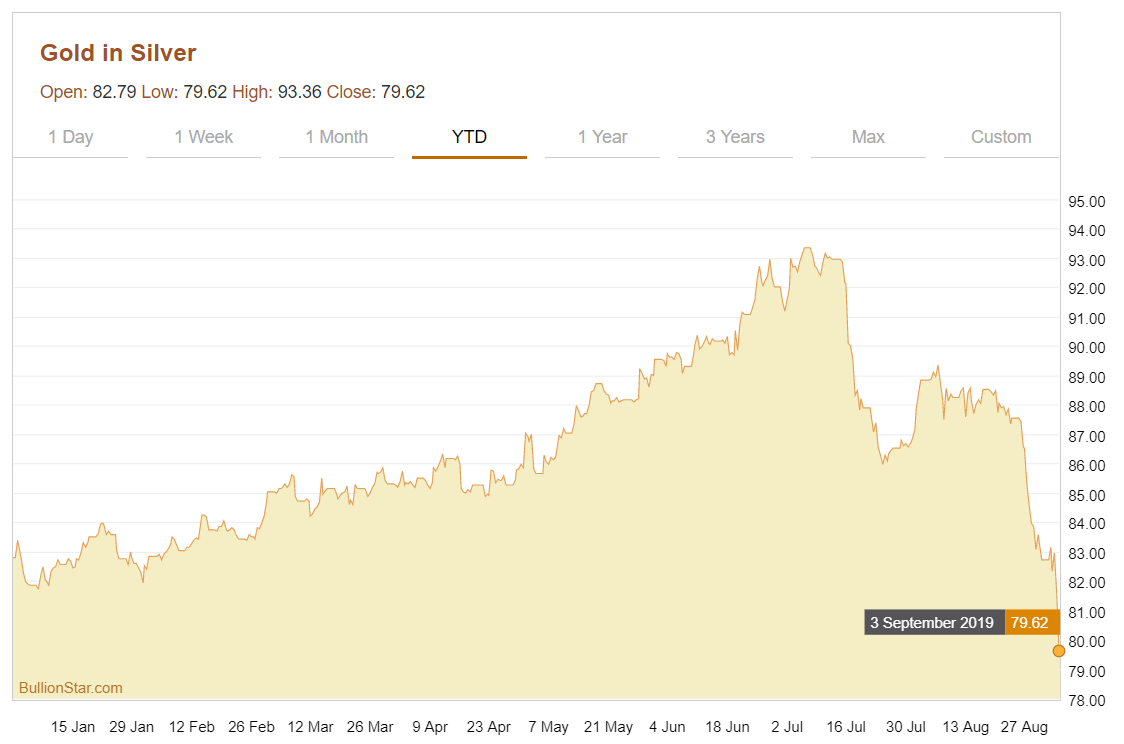
The Gold / Silver Ratio
The relative price movements of the three precious metals over the last three months also explain the changing dynamics of the Gold / Silver ratio and Gold / Platinum ratio over that time. The strong showing for gold in June brought the gold / silver ratio from 89 at the end of May up to 93 in early July. Silver’s outperformance in July then brought the ratio back down to the 86 -89 range, and more recently down further towards 79 as silver continued to streak ahead.
Gold’s June lead also pushed the Gold / Platinum ratio up to the 1.75 range in June, and then to 1.80 in August, but platinum’s recent surge has brought this ratio back down near 1.60.
Unchartered Territory – New All-Time Highs
While US dollars is the trading currency of precious metals on international markets, it is not the base currency / home currency for billions of individuals around the world whose wealth is denominated in currencies other than the US dollar, and whose income is generated in currencies other than the US dollar.
Loading...

