Select date

The Financialization of the US Economy


by Wolf Richter, Wolf Street:
![]() Services are Hopping. The #1 Biggie is Hopping the Fastest. It all adds to GDP!
Services are Hopping. The #1 Biggie is Hopping the Fastest. It all adds to GDP!
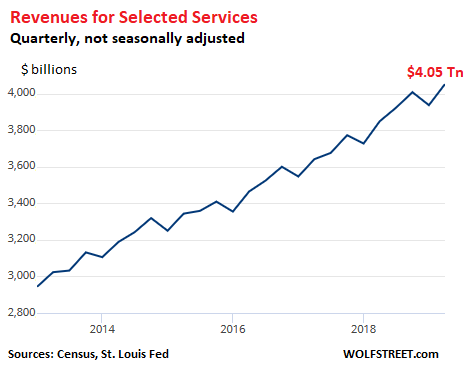
Service-producing industries dominate the US economy, accounting for over 70% of GDP. And this sector is hopping. Revenues in the major services categories rose 5.3% in the second quarter of 2019, compared to the same quarter a year earlier, to $4.05 trillion, not seasonally adjusted, according to the Commerce Department’s Quarterly Selected Services Estimates released today. For the first two quarters of 2019, service revenues rose 5.5% to $8.0 trillion. The pace of growth so far this year is slightly lower than the hot 6.0% growth for the year 2018.
Four biggies dominate the service sector, and the US economy overall. They accounted for $2.92 trillion in revenues in Q1, or about 72% of total service revenues, with the biggest of them all, finance and insurance, accounting for 32%, up from 31% at the end of last year. It is also the fastest-growing segment, even faster than healthcare, as the US economy is getting more and more financialized. The share of each of the big four of overall service revenues:
- Finance and insurance: 32%
- Healthcare: 17%
- Professional, scientific, and technical services: 12%
- “Information” services, such as telecommunications, software, and data processing: 11%.
#1 Biggie: Finance and Insurance.
Revenues in the finance-and-insurance sector rose 7.0% to $1.28 trillion in Q2, a new record, and the fastest growth of any major sector. For the first two quarters, revenues rose 6.9% to $2.54 trillion.
The sector includes the Federal Reserve, whose 12 regional reserve banks are privately owned institutions. But with its $26 billion in revenues in Q2, it’s a minor line item, representing 2% of total finance and insurance revenues. Its revenues fell 7.7% in Q1 and 6.9% so far this year, in part due to its shrinking balance sheet – and thus shrinking interest income. Without the drag of the Fed, finance and insurance revenues rose 7.4% in Q2.
The largest sub-segment is banking: Deposit-taking banks (commercial banks, credit unions, and the like); and nonbanks or shadow banks (lenders that don’t take deposits). Revenues jumped 7.0% in Q2 to a record $360 billion, with shadow banks having bypassed deposit-taking banks some time ago (if your smartphone clips the table, turn the device in landscape position):
| Q2 2019, $ billions | Change fr. Q2 2018 | YTD 2019, $ billions | Change fr. YTD 2018 | |
| Finance & insurance | 1,280 | 7.0% | 2,539 | 6.9% |
| Finance & insurance (except the Fed) | 1,254 | 7.4% | 2,485 | 7.2% |
| The Fed | 26 | -7.7% | 54 | -6.9% |
| Banks & Nonbanks | 360 | 7.0% | 714 | 8.2% |
| Deposit-taking banks | 164 | 6.7% | 326 | 8.2% |
| Nonbanks | 168 | 8.0% | 334 | 8.8% |
| Activities related to credit intermediation | 27 | 3.8% | 53 | 5.0% |
| Securities, commodity contracts, and other financial investments | 175 | 3.0% | 347 | 1.5% |
| Securities and commodity contracts, intermediation & brokerage | 80 | 4.1% | 160 | 2.4% |
| Securities and commodity exchanges | 3 | 12.2% | 6 | 5.4% |
| Other financial investment activities | 92 | 1.9% | 181 | 0.6% |
| Insurance carriers and related activities | 720 | 8.6% | 1,424 | 8.2% |
| Insurance carriers | 622 | 9.6% | 1,228 | 9.0% |
| Agencies, brokerages, and other insurance related | 98 | 2.7% | 196 | 3.5% |
#2 Biggie: Healthcare and Social Assistance
Healthcare and social assistance revenues are only about half of finance and insurance revenues. However, this sector does not include the goods-portion of healthcare, such as pharmaceutical products, medical devices, supplies, etc. Revenues rose 5.1% in Q2 to $695 billion; and 4.9% year-to-date to $1.37 trillion.
The table below shows the four categories of healthcare services. The largest, “ambulatory health care,” generated $270 billion in revenues in Q2, about half of which are generated by doctors’ offices. Note the much higher growth rates in some segments, such as social assistance, up 6.9% (if your smartphone clips the table, hold the device in landscape position):
| Q2 2019, $ billions | Change fr. Q2 2018 | YTD 2019, $ billions | Change fr. YTD 2018 | |
| Health care and social assistance | 695 | 5.1% | 1,373 | 4.9% |
| Ambulatory health care (doctors, diagnostics, outpatient, home health care) | 270 | 3.6% | 531 | 2.9% |
| Offices of physicians | 132 | 3.3% | 259 | 2.3% |
| Offices of dentists | 33 | 3.6% | * | 0.0% |
| Outpatient care centers | 37 | 5.2% | 74 | 5.4% |
| Medical and diagnostic laboratories | 13 | 1.3% | 26 | 0.9% |
| Home health care services | 22 | 2.3% | 43 | 3.3% |
| Other ambulatory health care services | 10 | 3.0% | 19 | 2.6% |
| Hospitals | 307 | 5.9% | 610 | 5.9% |
| General medical and surgical hospitals | 286 | 5.9% | 568 | 6.0% |
| Psychiatric and substance abuse hospitals | 7 | 2.5% | 14 | 3.0% |
| Specialty (except psychiatric and substance abuse) hospitals | 14 | 7.5% | 28 | 6.7% |
| Nursing and residential care facilities | 66 | 6.0% | 131 | 7.0% |
| Social assistance | 52 | 6.9% | 101 | 7.2% |
| Individual and family services | 27 | 7.3% | 53 | 8.2% |
| Community food and housing, and emergency and other relief services | 9 | 6.5% | 17 | 6.5% |
| Vocational rehabilitation services | 4 | 9.3% | 8 | 7.0% |
| Childcare services | 12 | 5.5% | 23 | 5.3% |
#3 Biggie: Professional services
Revenues grew 4.2% in Q2 to $511 billion; and 4.1% year-to-date to nearly $1 trillion. This sector is dominated by “computer systems design and related services,” which generated $116 billion in the quarter, up 7.1% year-over-year. The second largest segment is “legal services,” as is appropriate for the world’s most litigious society, up 4.2% in Q2 to $83 billion.
Advertising was the only segment in professional services, and one of the few segments in the overall service sector, where revenue growth was negative, for the quarter and year-to-date:
| Q2 2019, $ billions | Change fr. Q2 2018 | YTD 2019, $ billions | Change fr. YTD 2018 | |
| Professional, scientific, and technical services | 511 | 4.2% | 998 | 4.1% |
| Legal services | 83 | 1.9% | 159 | 4.4% |
| Accounting, tax preparation, bookkeeping, payroll services | 47 | 1.8% | 102 | 2.5% |
| Architectural, engineering, and related services | 89 | 4.6% | 172 | 1.3% |
| Computer systems design and related services | 116 | 7.1% | 226 | 7.5% |
| Management, scientific, technical consulting services | 71 | 6.0% | 138 | 4.1% |
| Scientific research and development services | 48 | 11.5% | 92 | 9.9% |
| Advertising, public relations, related services | 26 | -2.1% | 50 | -2.3% |
#4 Biggie: Information Services
Revenues rose 6.1% in Q2 to $430 billion, and 6.4% year-to-date to $847 billion. The sector is dominated by telecommunications, with $157 billion in Q2, up 2.0%. The fastest growing segments were software publishers (+ 11.4%), data processing services (+ 13.6%), and other information services (+ 14.8%):
Loading...


