Select date

Goods-Based Economy: Light at End of Tunnel? Oncoming Train?


by Wolf Richter, Wolf Street:
![]() Freight shipments and pricing.
Freight shipments and pricing.
Freight shipments within the US fell 3.0% in August 2019, compared to August 2018, the ninth month in a row of year-over-year declines, but it was only about half the rate of declines in May (-6.0%) and July (-5.9%), according to the Cass Freight Index for Shipments. The index tracks shipment volume by all modes of transportation – truck, rail, air, and barge – of consumer and industrial goods but not of bulk commodities. This decline was the least bad decline since March:
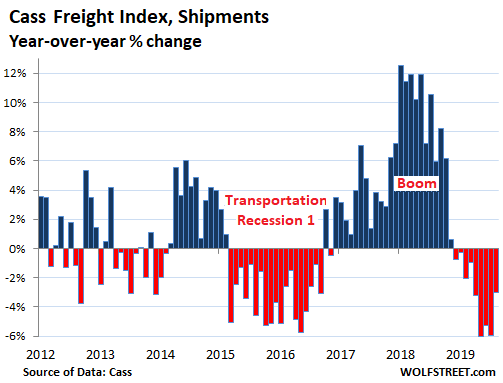
During the historic boom year in the transportation sector in 2018, the volume of shipments was far higher than in any prior year. This surge in shipments, as we now have figured out, was caused by companies, including manufacturers, trying to front-run the tariffs by ordering a lot more than they needed, hoping to lock in pre-tariff prices and filling their warehouses to the rafters with stuff.
Late last year, purchasing managers curtailed their ordering, triggering a broad slowdown in the transportation sector.
Shipments in 2019 (red line in the chart below) are solidly below 2018 (black line), but remain above all prior years, according to the Cass Freight Index for Shipments. While shipments in August 2019 were 3.0% below August 2018, they were the second highest on record for any August:
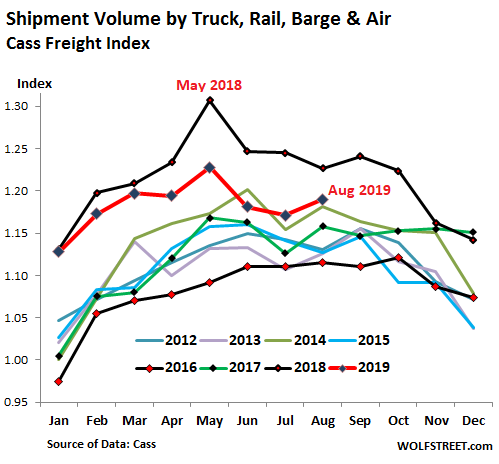
In the stacked chart above, note how in 2018, shipments fell sharply starting in October. There is nearly always a seasonal decline that time of the year, but the plunge in November 2018 was much larger than seasonality. This will make year-over-year comparisons easier later this year.
Also note that in August 2018, shipments fell from July, showing the first signs that the blistering boom was backing off. But this year, shipments in August rose from July. As a result, the year-over-year decline in July (-5.9%) was nearly cut in half in August (-3.0%).
These two factors indicate that shipments are beginning to stabilize at lower levels than last year, but at the second highest levels on record – a painful return to some kind of normal.
The index for shipments is a reflection of the goods-based economy, except commodities. The consumer – that mythic creation that lumps all members of this bifurcated economy into one bucket – is buying, and retail sales in August jumped by 4.6% year-over-year, driven by booming ecommerce sales. Whether brick-and-mortar or ecommerce sales, these goods have to be shipped.
But the industrial economy has been weak. This includes manufacturing and more broadly, industrial production. Due to the oil bust part two, there are now investment cutbacks underway in the oil-and-gas sector, a huge industry in the US, the largest oil and natural gas producer in the world. This also impacts manufacturing, such as of drilling equipment.
So what we’re seeing here is strength in shipments by the retail industry, but weakness in industrial goods, including intermediate industrial goods, such as components, that are shipped in containers to manufacturers.
In terms of railroads, the number of carloads (commodities, motor vehicles, etc.) fell 4.6% year-over-year in August, according to the Association of American Railroads (AAR). Given the oil production boom, and the lack of pipelines connecting some of the new producing regions with refineries, carloads of petroleum & petroleum products jumped 7.8%. But coal, the biggie for railroads, continued to get crushed, with carloads down 9.9% year-over-year. Excluding coal, carload traffic was down just 1.9%.
Intermodal traffic (containers hauled by truck or ship and then transferred to rail, or semi-truck trailers that piggyback on special rail cars) fell 5.4% in August. This segment is heavily impacted by competition from the trucking industry. And truck freight rates have dropped sharply from last year – which raises the appeal of shipping merchandise by truck.
In trucking, the nationwide average rate in the spot market for van loads dropped 15.4% year-over-year in August, to $1.81 per mile, according to DAT. Contract rates dropped 10% to $2.14 per mile. Flatbed spot rates fell 16.7% to $2.20 per mile. And flatbed contract rates fell 5.9% to $2.57 per mile. These declines appear to be shifting some volume from rail to trucks.
The total amount that shippers such as industrial companies, retailers, and wholesalers spent on freight by all modes of transportation fell 2.6%.
This is a function of shipment volume, freight rates, and fuels surcharges, according to the Cass Freight Index for Expenditures. Despite the drop in shipments for 10 months in a row, it was only the third year-over-year decline in expenditures, as freight rates overall had continued to rise during the early phases of the shipment slowdown:
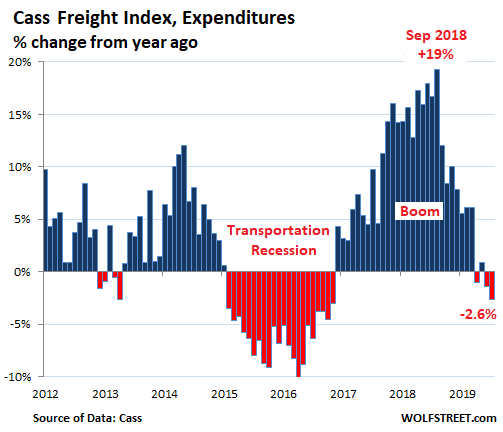
In the chart above, note the 19% year-over-year spike in expenditures in September 2018, when shippers were complaining in their earnings reports about high transportation costs and a capacity squeeze. Consequently, the year-over-year drop in expenditures for this September from the sky-high level in September last year is going to be zinger – though it will be the second highest spending for any September on record:
Loading...


