Select date

Yield Curve Un-Inverts, 10-Year Yield Spikes, Middle-Age Sag Disappears


by Wolf Richter, Wolf Street:
![]() Yield Curve Spaghetti!
Yield Curve Spaghetti!
It happened. Hallelujah. Or maybe better: Watch Out! The yield curve, after having been at least partially inverted all year, un-inverted today.
The yield curve still kind of flat at the short end, but the middle-aged sag is gone, and the long end with maturities of seven years and up is higher than the short end. It’s not exactly spectacularly steep, but all the long-dated yields are higher than the shorter-dated yields. The chart shows the yield of each maturity today at the close of the bond market, from one month on the left to 30 years on the right:

And this happened because several factors came together:
- Prices of Treasury securities with longer maturities got battered in recent days – which means their yields rose. The 10-year yield today jumped to 1.86%. OK, that’s still low, but it’s a lot higher than where it had been in August (dipping to 1.47%). And the 30-year yield rose to 2.34%.
- The Fed’s latest rate cut has been working itself into the yields of short-term Treasury bills. Also, the Fed is buying T-bills as part of its combat with the repo market. So it pushed up prices of T-bills and yields have fallen, with the one-month yield today dropping to 1.56%.
- And the middle of the curve has adjusted and straightened out.
The Treasury yield curve inverted this year in a peculiar fashion: The 10-year yield was below the 2-year yield only briefly. But there had been a persistent middle-age sag, as I have come to call it, where the middle of the curve – maturities from six months to five years – was lower than not only the very short end of the curve (maturities from one month to six months), but also the long end, with maturities from seven years to 30 years.
The chart below shows the yield curves on seven days, from December 14, 2016, when the Fed got serious with rate hikes (green line coming up from the bottom), to today (the thick red line):
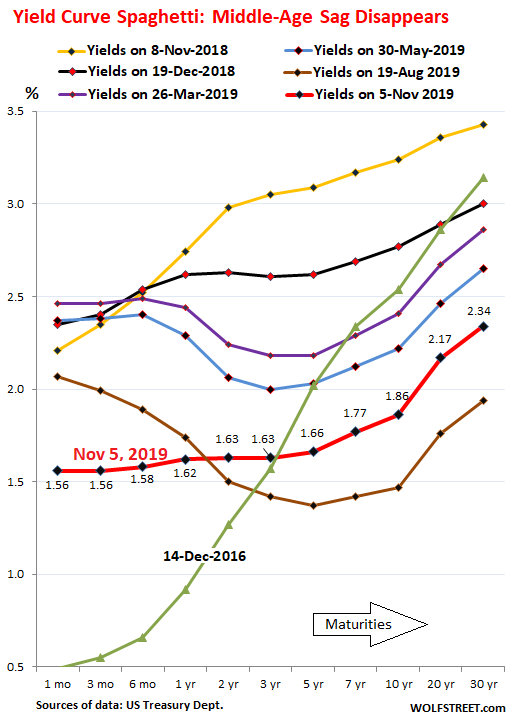
You can see how the rate hikes from December 2016 (green line) through December 2018 (black line, second from the top) pushed up short-term yields quite a bit, but did not move long-term yields much, with the 20-year yields of both being about the same. The refusal of the markets to push up long-term yields, as short-term yields were rising, flattened out the yield curve.
By December 2018, the sag in the middle was already appearing, and it got worse and worse until it maxed out in August 2019 (brown line). Since then, the Fed cut rates twice, which brought down the short end. In addition, long-term yields have risen.
Loading...

