Select date

US Freight Shipments Skid Below 2014 Level, Hit by the Slowdown in Industrial, Manufacturing & Construction


by Wolf Richter, Wolf Street:
![]() Efforts to frontrun tariffs was part of it. But now, there’s more to it.
Efforts to frontrun tariffs was part of it. But now, there’s more to it.
Freight shipments have declined on a year-over-year basis all year. Until today, the declines were from the extraordinary shipment boom that started in late 2017 and lasted into late 2018. It had been stimulated by efforts to frontrun the tariffs, where companies over-ordered to get the merchandise and equipment before the tariffs would hit. With today’s data, this image has changed for the worse. Freight shipment volume fell not only below the October 2018 level, but also below the October 2017 and October 2014 levels, which predate the tariff-frontrun era.
Freight shipment volume in the US by truck, rail, air, and barge fell 5.9% in October 2019, compared to October last year, according to the Cass Freight Index for Shipments. It was the 11th month in a row of year-over-year declines, and the third month out of those 11 when year-over-year declines were around 6%. This chart shows the percentage change per month, compared to the same month a year earlier – and it also shows infamous cyclicality, the boom-and-bust cycles, of the business:
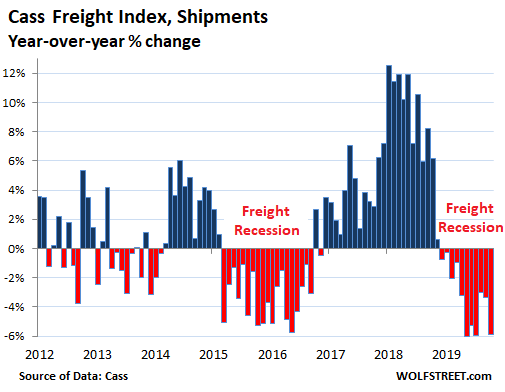
The Cass Freight Index is a measure of the goods-based economy. It tracks shipment volume of consumer goods and industrial goods such as construction materials; products, equipment, and components being shipped to or by manufacturers; and supplies and equipment for oil & gas drilling. But it does not track bulk commodities, such as grains.
The decline in shipments in October was so steep that the index fell below the level where it had been not only in October 2018 but also in October 2017 and October 2014.
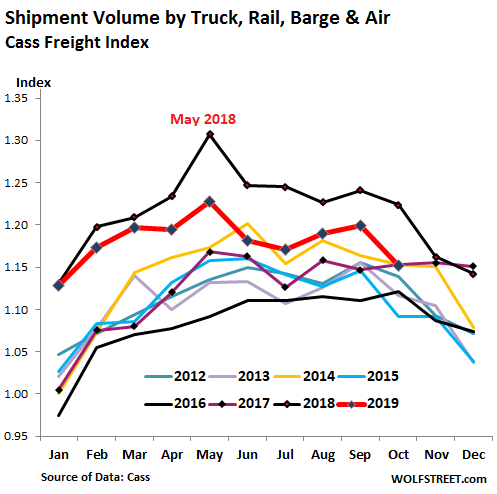
In addition to being infamously cyclical, the business is also very seasonal. The stacked chart below, for the years going back to 2012, shows this seasonality. Note how the index for 2019 (red line) in October dropped more sharply than normal seasonal patterns, and fell below 2017 (purple line) and 2014 (yellow line). Now shipment volume has not only fallen below some record outlier boom figure but below two other years:
Where does this slowdown in transportation come from?
Not the consumer. Retail spending in October, while not red-hot, grew 2.9% from October last year, propped up by the boom in ecommerce, according to the Commerce Department this morning. These goods have to be shipped.
Yes, from the industrial economy. Industrial production surged in late 2017 and 2018 as companies were frontrunning the tariffs, with year-over-year growth rates peaking at 5.5%, the fastest growth since the recovery from the Great Recession. From the peak in December 2018, industrial production has fallen 1.8% as of October 2019, according to Federal Reserve data this morning; and it was down 1.1% year-over-year, the steepest such decline since 2016. Industrial production includes manufacturing, oil & gas drilling, mining activities, and utilities. Transportation plays a big role in that sector.
Yes, from construction. Construction spending all categories combined – residential, non-residential, private and government – in September fell 2% from a year ago and is down 3.1% from the peak in February 2018, according to the Commerce Department two weeks ago. And construction requires a lot of materials and equipment that need to be transported.
Maybe from the agricultural sector. This shipment data here does not include agricultural commodities. So the big dynamics in the ag business – including floods, droughts, or the “trade war” – impact this shipment data only in terms of non-commodity items, such as equipment.
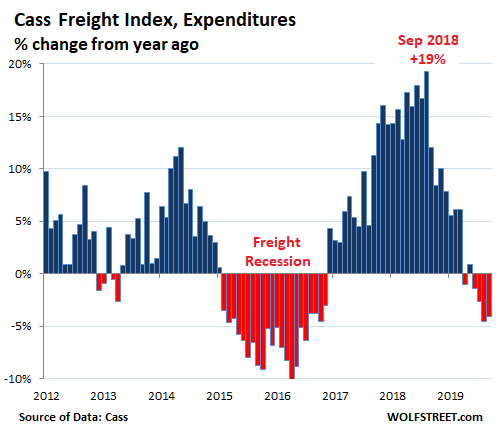
Consequently, freight expenditures decline.
Given the decline in demand for transportation services, freight rates have started to decline, and overall the amount that shippers, such as retailers, wholesalers, and industrial companies, spent on freight, including fuel surcharges, has declined 4.1% in October, according to the Cass Freight Index for Expenditures. It was the fourth month in a row, and the fifth month out of six of year-over-year declines.
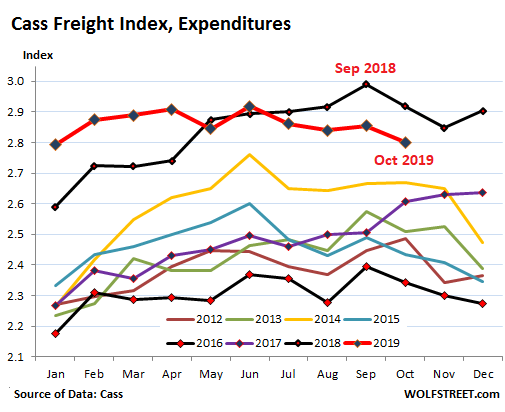
The stacked chart below shows the soaring shipping expenditures in 2018 (top black line) that were totally out of whack with prior years, with double-digit year-over-year increases from October 2017 through December 2018. Then the decline in shipments took the pressure off and now truckers and railroads are facing excess capacity, downward pressure on rates, and lower volume. But spending remains high compared to all prior years except 2018. Note how in late 2017 (purple line) freight expenditures began to soar against seasonal trends:
The transportation sector is notoriously cyclical and linked tightly to the goods-based economy. Services, such as finance, insurance, and health care, dominate the US economy. The goods-based sector is small by comparison. But transportation is also a service, and like some other services, it depends on the goods-based sector, and reflects its weakness. And it’s one of the ways in which weakness in the goods-based sector creeps into the services sector.
Loading...