Select date

Housing Blues in the Heart of California’s “Wine Country”


by Wolf Richter, Wolf Street:
 The priciest markets north of the San Francisco Bay.
California’s “Wine Country” is typically considered to include the counties of Napa, Sonoma, Mendocino, Lake, and Solano. We’ll look at the housing markets of the two most expensive, Napa and Sonoma; and at Marin County, sandwiched between the Golden Gate Bridge and Sonoma County. Marin County is not famous for wine, but for its beauty – including the Muir Woods National Monument, Mount Tamalpais, and Sausalito – and for being a high-end cloistered bedroom community of hurly-burly San Francisco.
Sonoma County.
Back in early August 2018, while the Bay Area Housing market was still considered to be on a trajectory of endless boom, I stuck my neck out to point at the underlying dynamics that indicated the market in Sonoma County was undergoing a turning point. I was leaning on data and boots-on-the-ground observations by Thomas Stone, a Sonoma County real estate broker.
The underlying dynamics have now settled down, going from a feverish market in early 2018 to something much more subdued, and prices have come down.
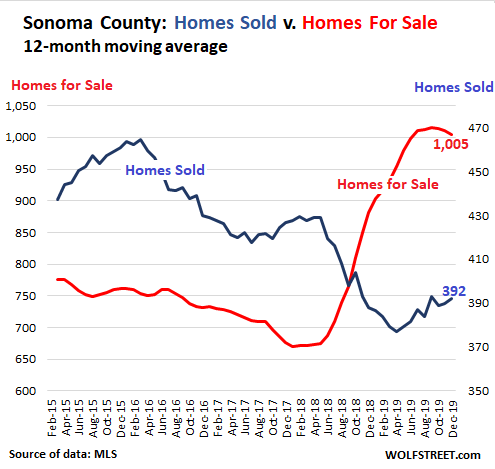
Supply has surged over the two-year period: 700 homes were for sale in December 2019 in Sonoma County, down 8.9% from December 2018, but up 72% from December 2017 (406 homes for sale).
And sales have fallen over the two-year period: 336 homes were sold in December, up 8.0% from December 2018 but down 8.7% from December 2017, and down 25% from December 2015 (450 home sales).
This data is very seasonal, with low points in the winter. The 12-month moving average eliminates the seasonality and shows the longer-term trends:
The average price of homes listed for sale went through a steep $500,000-drop between October 2017 ($1.6 million) to August 2018 ($1.1 million), then experienced a partial recovery, only to sag again, impacted by market conditions, as sellers were trying to find where the buyers are, and by the number and prices of high-end homes in the mix. The average price of homes for sale in December, at $1.26 million, was below where it had been in December 2015:
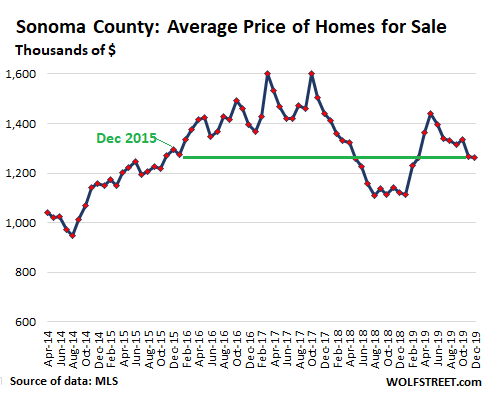
Homes remained on the market on average 72 days in December before they were either sold or pulled off the market, which was about flat compared to December 2018, but was up from 61 days in December 2017.
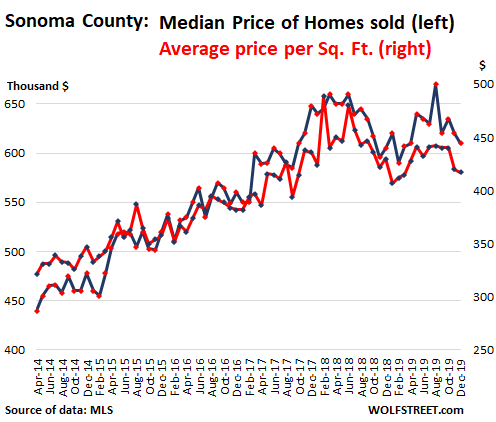
And prices of homes that have actually sold followed a similar pattern. Sonoma County doesn’t have that many transactions per month, and so data can get jumpy, influenced not only by changes in price levels but also by changes in the mix of homes that sold – for example, a greater proportion of large homes in the mix, which happened in August 2019, when the median price (half of the homes sold for more, half sold for less) spiked to $670,000 (blue line in the chart below), while the average price-per-square-foot, which eliminates the issue or larger homes in the mix, remained unchanged (red line).
Over the longer term, the median price and the average price per square foot show similar trends. In December:
- The median price, at $610,000, was down 10% from that August spike, was roughly flat with December 2018, and was down nearly 6% from December 2017.
- The average price-per-square-foot fell to $417, down 3% from December 2018 and down 4.4% from December 2017:
These prices include single-family houses and condos, but condos play only a small role, with 40 sales in December, and the median price dropped 13% from a year ago, to $345,000.
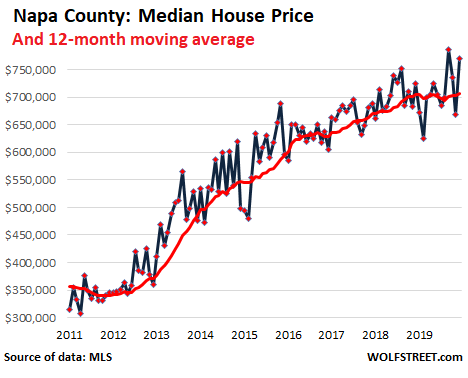
Napa County.
There are even fewer home sales per month in Napa County than in Sonoma County, and condos play practically no role, with zero condo sales in December (condo sales peaked in March and June with three sales each).
In December, 244 houses were for sale, down from 253 in December 2018. The average price of houses for sale, at $2.75 million, was up from $1.9 million in December 2018, with expensive homes lingering on the market and in the data for a long time. Overall, houses lingered on the market for longer, on average 88 days in December, before being sold or pulled off the market, compared to 80 days in December 2018.
Loading...


