Select date

Has the Coronavirus Hit US Consumer Spending Yet?


by Wolf Richter, Wolf Street:
 In January, consumers carried on in hunky-dory land.
Consumer spending accounts for roughly 70% of the economy as measured by GDP. When and how will the reaction by consumers to the coronavirus – dollars spent and not spent – become visible in the overall economic data? That’s the question we’ll try to find answers to going forward. But according to the Bureau of Economic Analysis today, in January, American consumers in aggregate were still in hunky-dory land.
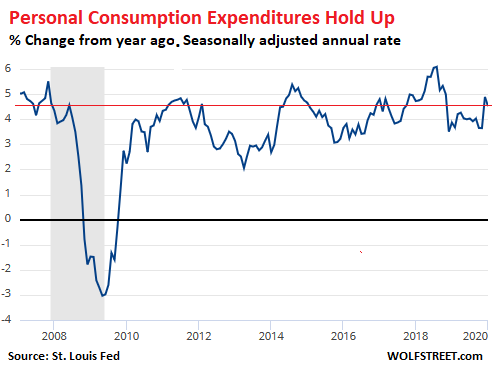
The broadest measure of what consumers spend in the US, Personal Consumption Expenditures, rose 0.2% in January from December (seasonally adjusted) and 4.5% from a year ago to a record annual rate of $14.87 trillion. In the chart, note what happened to consumer spending during the Financial Crisis. If consumer spending holds up, the economy will wobble through the coronavirus. But if consumer spending dives, all bets are off:
Personal consumption expenditures include nearly everything consumers spend in the US for goods and services but also mortgage interest payments which are part of “rent.” But it does not include what they send or spend overseas.
Nearly 70% of consumer spending goes to services. Here are the major categories of spending, with year-over-year growth rates and the dollar amount expressed in “seasonally adjusted annual rate” (meaning that at the current pace of spending, this would be the total amount spent in a year):
- Durable goods such as cars or furniture: + 4.8% to $1.56 trillion annual rate.
- Nondurable goods, such as groceries, cosmetics, fuel or paper products: + 3.8% to $3.02 trillion annual rate.
- Services, such as rent, mortgage interest, insurance, healthcare, haircuts, dry-cleaning, or education: + 4.7% to $10.30 trillion annual rate.
Interest payments on credit cards, auto loans, or student loans, etc. (everything but mortgage interest) are tracked separately from personal consumption expenditures but are part of the overall “Personal Outlays.” They rose + 0.7% to $361 billion annual rate.
So, consumers spent liberally in January. A month from now, we’ll find out how they did in February. But given the lag in the data and given that February was nearly over before US consumers in aggregate started to think seriously about how to react to the coronavirus, we may have to wait till the March spending data is released in April to see the first real signs of a hit to consumer spending.
And the moolah was rolling in.
Personal income – the amount of money consumers received from all sources – rose 4.0% in January compared to a year earlier, to a record of $18.98 trillion. By major category, in order of magnitude:
- Compensation of employees, such as wages and employer-contributions to health insurance, pension plans, and government social insurance: + 3.7% to $11.63 trillion annual rate.
- Government payments, such as Social Security, Medicare, Medicaid, Unemployment insurance, and VA benefits: + 5.7% $3.2 trillion
- Personal receipts on assets, such as interest payments received, but not including capital gains: + 2.9% to $3.04 trillion annual rate
- Proprietors’ income, farm and nonfarm: + 4.5% to $1.70 trillion annual rate.
- Rental income of individuals: + 4.4% to $0.8 trillion annual rate.
And they saved a ton.
Disposable income – personal income minus taxes and contributions to government social insurance – rose 4.0% to a record $16.76 trillion annual rate.
Their disposable income is what consumers spent on goods, services, interest and the like. And the amount of disposable income that they didn’t spend is considered “savings” – though this doesn’t mean it went into savings accounts
This “personal savings” amounted to $1.3 trillion annual rate, or 7.9% of disposable income (the so-called “savings rate”). In other words, at this rate, consumers would “save” – meaning “not spend” – $1.3 trillion of their $16.67 trillion in disposable income in 2020.
So overall, in the data for January, consumers in aggregate held up well, making money and spending money, and saving money too, in hunky-dory land. And the impact of any decisions related to the coronavirus has not shown up yet.
Loading...

