Select date

“We Have Never Seen This Before”: The Last Time The Market Did This, FDR Confiscated All The Gold


from ZeroHedge:
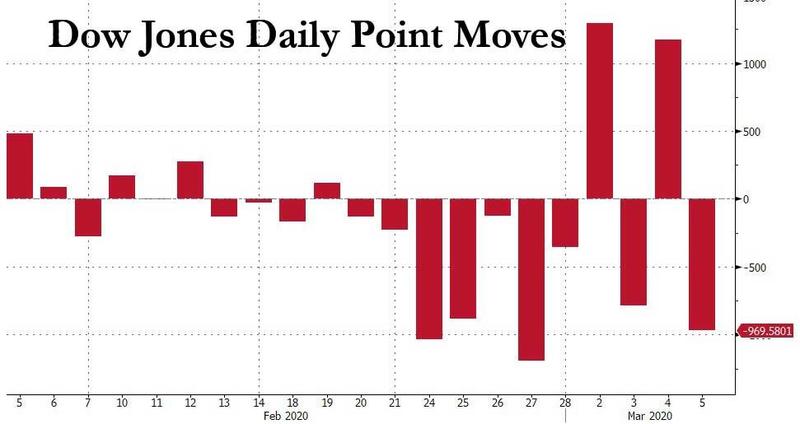
To say that moves in the US stock market have been erratic in the past two weeks would be a prodigious understatement: with the Dow Jones swinging by over 1,000 points on nearly 5 occasions in the past two weeks (today’s 970 point move would have been the fifth)…
… traders – holding on for dear life in a market rollercoaster the likes of which have not been seen in years – have given up trying to make sense, and are just praying they don’t lose all their money. “When you have a 4.5% up day in the market and a 2% down day – what does that mean?” Kathryn Kaminski of AlphaSimplex Group told Bloomberg. “It just means we don’t know what’s going on.”
And while futures continue to slide amid a surge in US coronavirus cases late on Thursday with over 2,000 New Yorkers now having self-quarantined, and emboldening what little is left of the bears – recall that heading into this week, single stock/ETF short interest was at all time lows…

… the bulls, who are rapidly losing faith that even the Fed can prop up this market, are pointing to the recent dramatic rebounds in the stocks most recently on Wednesday when the S&P500 surged back above 3,124 (it is now trading well below 2,990), yet which nobody can fully explain because even though there are several catalysts for the rebound that one could point to, historically speaking none of them are entirely satisfying as explanations, and as Nomura’s Masanari Takada writes in his daily Nomura quant note, “we suspect that more than a few investors (whether bearish or bullish) are feeling paralyzed in the face of such unusual swings in the market.”
However, it is what he says next that struck us as a stark admission that we have crossed the rubicon into a market that nobody, not even grizzled quant veterans, can explain: “We have also been at a loss to predict the market’s movements, and feel painfully reminded of the difficulties involved in drawing a story from nothing more than day-today changes in the market.”
And the punchline: “Even so, what is happening now is like nothing we have seen before.”
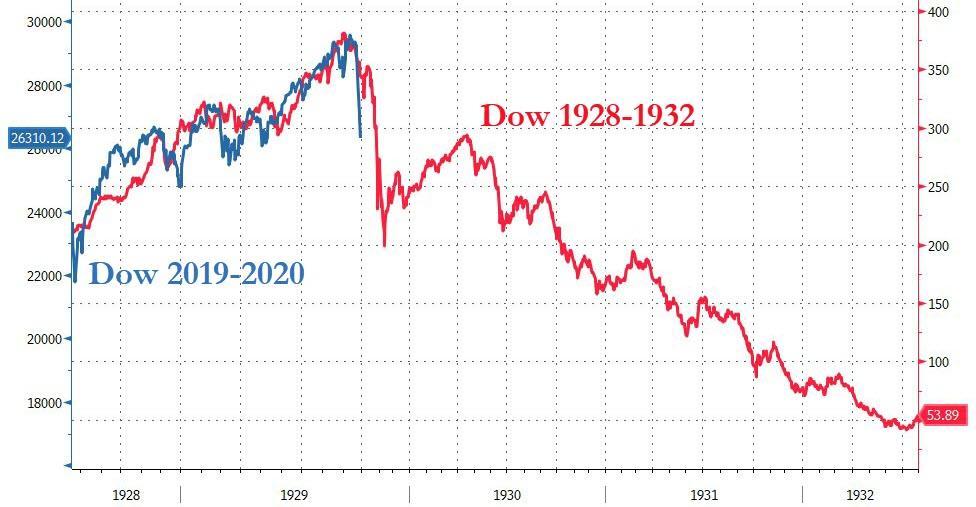
To be sure, here one can counter that maybe “we” simply haven’t been around long enough, and one just needs to extend the time horizon to observe a similar market to the one we have today. And so, indeed, without wandering too far off into the weeds, Nomura picks up on something we highlighted last week, namely that the market’s drawdown to a 10% correction from an all-time high was the fastest since just weeks before the great depression started…
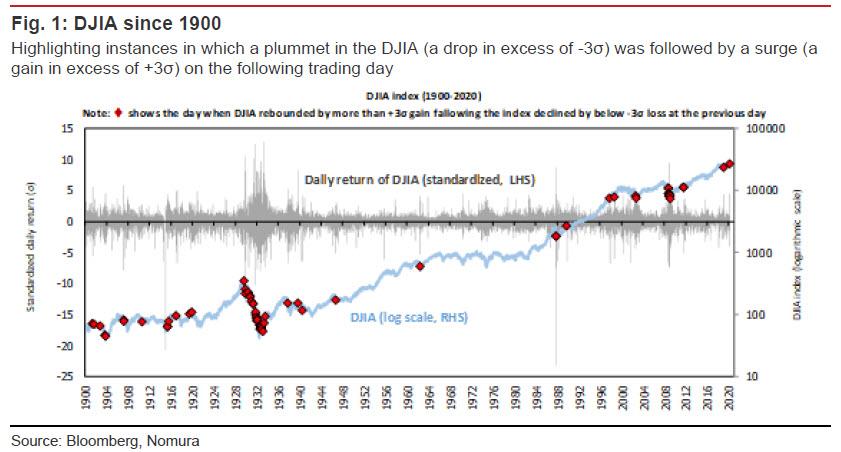
… and observes that there have been only 65 occasions since 1900 in which the DJIA has recorded a daily loss in excess of three standard deviations over the average daily return only to log a gain in excess of three standard deviations on the following trading day, and 70% of those occasions were concentrated in the 1900-1950 span, as happened this week on Tuesday and Wednesday (3 and 4 March), and 70% of those occasions were concentrated in the 1900-1950 span. In percentage terms, this is a frequency of just 0.21%.
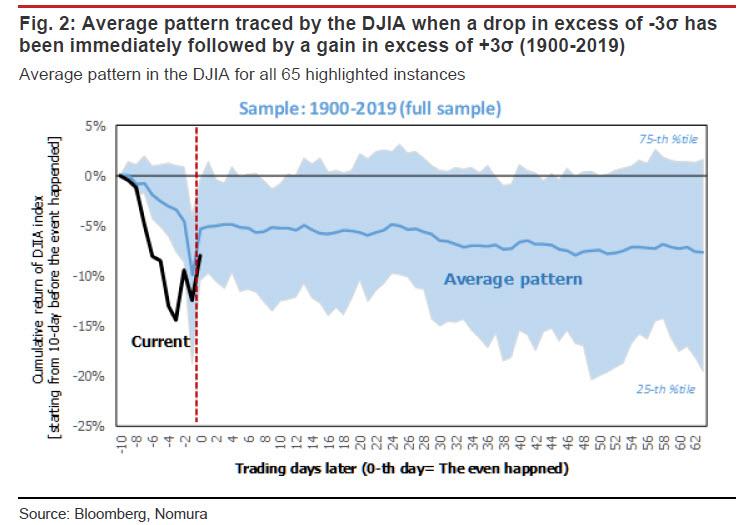
The last time this happened (14 January 2019), the market enjoyed a sustained rally, but the time prior to that (11 August 2011), no such rally ensued. Figure 2 is a plot of the average pattern followed by the market after each of these occasions, using the full sample of 65 instances between 1900 and 2019.
Yet while recent events are an extreme rarity across the entire historical spectrum, there is one distinct point in time when we observe cluster of activity similar to the furious market action noted in recent days (something tells us readers can already figure out which period we are talking about).
But before we get there, Takada writes that “it may be instructive to split this long span of time into two blocks (1900- 1950 and 1951-2019), as the impact of the Great Depression and the two world wars can be cordoned off in the 1900-1950 block. Even when back-testing the data in this fashion, however, we find no evidence that a gain in excess of three standard deviations on the day after a loss in excess of three standard deviations necessarily indicates that a bottom has been marked.
Loading...


