Select date

S&P 500 Plunged Most Since 1987, Gave Up in 18 Days the 42% Gains of Past 3 Years. Boeing Shares Collapsed


by Wolf Richter, Wolf Street:
 It’s not the drop that worries me, it’s the historic neck-breaking volatility.
It started out ugly Sunday night and ended uglier today. Sunday evening, stock futures plunged 5%, hit limit down, and trading was halted. Futures remained pinned at limit down without further trading. When stocks started trading in the morning during regular hours, the S&P 500 Index opened at 2,490, down -8.1%. This was below the limit down rule during regular hours where trading should stop for 15 minutes if the index drops 7%. But it had blown through this limit-down from the first moment.
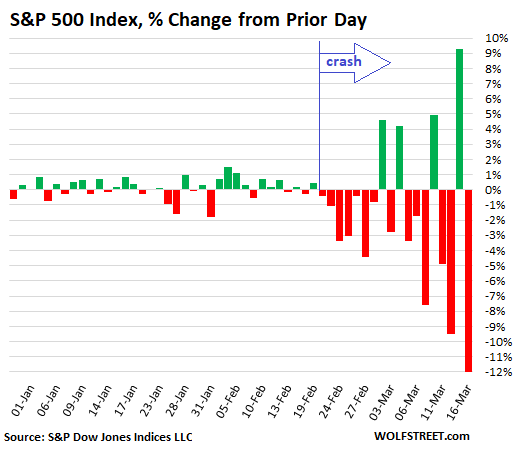
Trading was halted at the point. When trading resumed 15 minutes later, the S&P 500 index instantly fell to 2,412 (-11%) before it started moving higher. But the partial recovery, if you can call it that, only lasted about one-and-a-half hours, before stocks gave up their ghost, and the S&P 500 index broke through the 2,400 level, closing the day at 2,386 after a nasty drop-off at the end of the day. The index ended the day down 12%, the biggest ugliest one-day drop since Black Monday in October 1987:
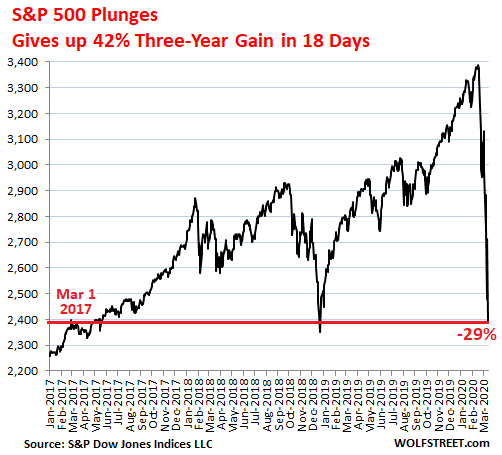
The S&P 500 index has now plunged 29% in the 18 trading days since the peak in February 19 and is below where it had first been on March 1, 2017 – which was over three years ago. In other words, the S&P 500 unwound three years’ worth of gains in 18 trading days.
Another way of looking at this: Over the three years from March 1, 2017, through the peak on February 19, 2020 (3,386), the S&P 500 had gained a blistering 42%, all of which are now gone.
It’s not the drop that worries me, it’s the historic nerve-rattling Volatility.
What’s so concerning is not the 29% drop of the S&P 500; drops of this kind are sort of routine and part of larger crashes that recur every decade or so since the 1980s. The last two times, it led to sell-offs of over 50%. So that’s to be expected.
What’s concerning me – and what makes this such a dreadful harbinger – is the record-breaking, neck-breaking, nerve-rattling, immensely messy and chaotic volatility, the huge down-days followed periodically by a huge up-day, and the numbers are just gigantic and historic and mind-boggling, and they’re getting bigger.
Every one of the past six trading days was a move up or down between around 5% and 12%, including two moves over 9% followed by a 12% move back-to-back. This has never happened before:
Volatility is typical of crashes. During the Financial Crisis crash, the S&P 500 jumped by the double digits a couple of days as well. But these moves weren’t back-to-back like this. During the financial crisis, there was no single period of four days in a row of 2% or higher moves. Now we had six days of around 5% to 12% moves.
This worst drop since 1987 Black Monday occurred after the Fed’s emergency teleconference meeting on Sunday afternoon, when it decided to roll out another shock-and-awe program, after the shock-and-awe program it rolled out last Thursday. It cut rates to near 0% and threw $700 billion in QE on top of it, along with a series of other measures, along with over $1 trillion a week in repo cash.
This shows how record-scared the Fed is that its Everything Bubble that it so assiduously inflated over the past decade is coming unglued in just a matter of days.
Here is Fed Chair Jerome Powell’s reaction, upon seeing the 12% plunge in the stock market today, as envisioned by cartoonist Marco Ricolli, exclusively for WOLF STREET, because, folks, you gotta keep your sense of humor in these trying and crazy times:
The Dow Jones Industrial Average got beaten down even worse today, plunging by nearly 3,000 points, and losing 12.9%, to end the day at 20,188, down by 32% from its all-time high. I’ve started to dig through my junk drawers to locate my DOW 20,000 hat.
Loading...