Excellent Silver Seasonal Buying Opportunity Lies Directly Ahead
by Dimitri Speck, Market Oracle:

In recent issues of Seasonal Insights, my colleague Tea Muratovic and I shared our analysis of global stock markets with you.
Today I want to put a popular precious metal under the magnifying glass for you: silver.
Silver, often referred to as the “little brother” of gold, has a particularly interesting seasonal pattern I would like to show to you.
Silver’s seasonality under the magnifying glass
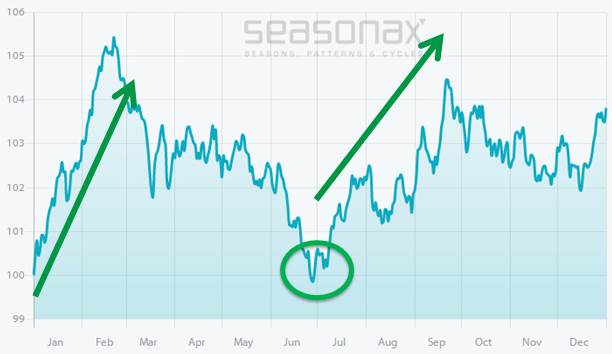
Take a look at the seasonal chart of silver. In contrast to a standard price chart, the seasonal chart shows the average pattern of silver in the course of a calendar year. For this purpose, an average was calculated from the price patterns of the past 52 years. The horizontal axis shows the time of the year, the vertical axis depicts price information.
Silver price in USD per troy ounce, seasonal pattern over the past 52 years

Silver starts to rise at the end of June
Source: Seasonax
As the chart illustrates, there are two favorable seasonal phases in silver. The first one begins in mid December (i.e., on the right hand side of the chart) and lasts until February (due to the turn of the year on the left hand side of the chart; arrow to the left).
The second one starts at the end of June and lasts until the end of September (arrow to the right).
In addition I have highlighted the beginning of this second phase with a circle.
The silver price rose in 31 of 52 cases!
The imminent strong seasonal period in silver begins on 28 June and ends on 21 September. A positive performance was recorded in 31 of the 52 cases under review.
During this phase silver generated an average gain of 4.87 percent, which corresponds to an annualized return of 22.71 percent.
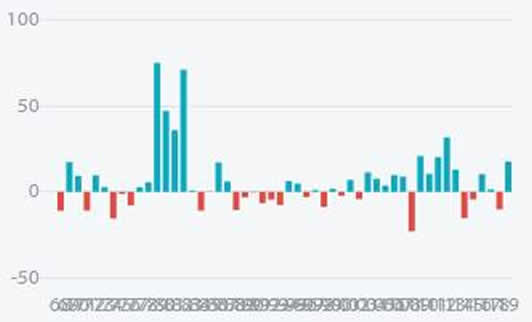
The bar chart below shows the return generated by the silver price during this seasonally strong period in every year since 1968. Blue bars indicate years in which gains were achieved, red bars show years in which losses were posted.
Silver in USD, return in percent between 28 June and 21 September in every year since 1968

Gains predominate.
Source: Seasonax
On two occasions the price increase reached even more than 70 percent. A particularly strong advance of 75.15 percent was recorded in 1979. The largest loss was posted in 2008. At 23.08 percent it was noticeably smaller.
In short, the imminent strong seasonal phase not only includes an above-average number of especially strong gains, but also fewer and less pronounced declines.
Read More @ MarketOracle.co.uk


