Select date

Fired up by Stimulus Money & Debt Deferrals, Americans Went Shopping. But Where? How Life Changed During the Pandemic


by Wolf Richter, Wolf Street:
 In 12 Whiplash-Inducing Charts.
Retail sales by category of retailer show how Americans have adjusted to the Pandemic and to a very peculiar financial situation. Spending was supported by stimulus money that included the extra $600 a week in federal unemployment benefits. A study by the Becker Friedman Institute for Economics at the University of Chicago found that two-thirds of the people who received unemployment insurance made more from UI than from working, with about 20% of them doubling their pay.
This scenario of cash coming into the house is further supported by cash not flowing out the house to make debt or rent payments. Millions of people have entered into debt-payment deferral or forbearance programs and skipped making payments on their mortgages, credit cards, auto loans, and student loans. Others, protected temporarily by eviction bans, skipped making rent payments. This money not-spent on debt and rent was then spent elsewhere.
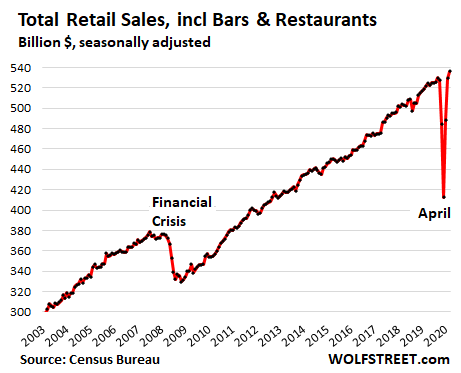
Retail sales show how this panned out – and there are large differences by category, reflecting big shifts in how and on what Americans spent their money. According to Census Bureau data this morning, total retail sales in July ticked up by 1.2% from June, to $536 billion (seasonally adjusted) after some big bounces in May and June, from the collapse in March and April. Compared to July last year, total retail sales were up 2.7%:
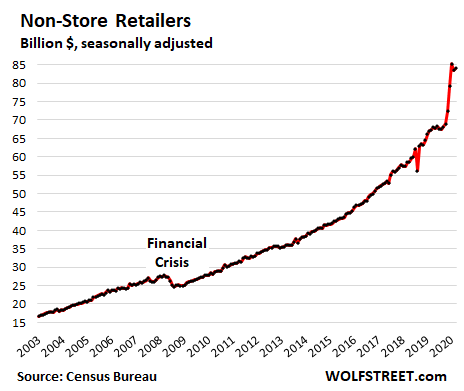
Sales at “Non-Store Retailers” – mostly ecommerce sales – spiked during the lockdowns and then remained about level over the past two months. In July, they were up 25% compared to July last year. At $84 billion, they now account for 17.4% of retail sales (without restaurants and bars).
This category overlaps with much of ecommerce but also includes other non-store retailers such as mail-order operations, door-to-door sales, and sales at stalls and vending machines, which have gotten crushed. Proper ecommerce sales for Q2 will be released in a few days.
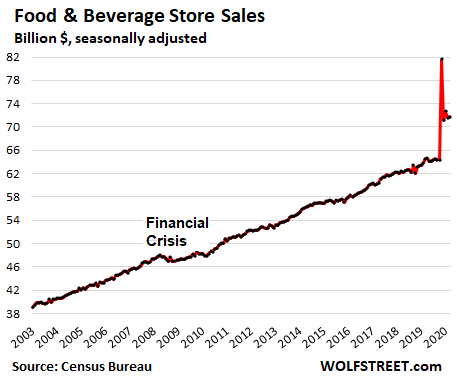
Sales at Food and Beverage Stores unwound part of the 18% spike in March during the beginning of the lockdowns when everyone rushed to the grocery store to load up – triggering the national “empty shelves era” that many people will never forget. But in April, sales fell back and have remained stable since then, but still 11% above the Old Normal last year. The recent months reflect a dramatic shift from eating out and eating at work and school, to eating at home:
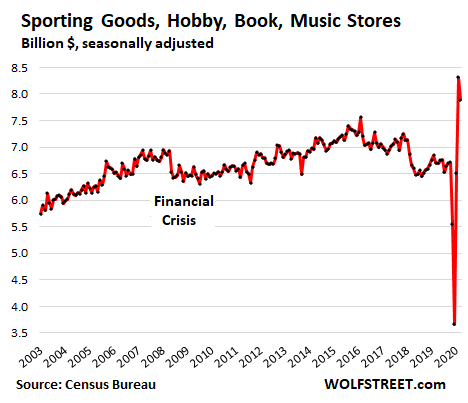
Sales at sporting goods, hobby, book and music stores went wild. They’d already been dragging for the past three-plus years, then came the Pandemic, and the bottom fell out in March and April. But then people figured out that it would be nice to have a bicycle to ride for exercise or transportation, and bike shops anecdotally reported booming sales and customers reported depleted choices and long wait times.
Others, stuck at home, decided to pick up their long-lost passion for playing an instrument in between Zoom calls with their boss. Camping suddenly became a hot vacation option, and sales of camping gear took off. Stories like these were everywhere.
And it shows up in the numbers. In June, sales at these stores hit an all-time high. In July, sales ticked down some but were still up nearly 18% from a year ago. But in the overall retail-scheme of things, the dollar amounts are small: less than $8 billion:
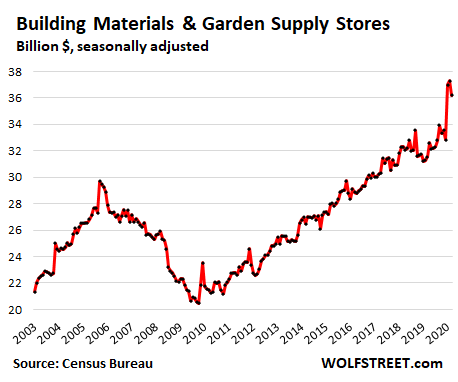
Sales at building materials, garden supply and equipment stores (including neighborhood hardware stores and big-box stores like Home Depot) had spiked 13% in May from April, ticked up further in June, but fell off some in July.
There have been innumerable stories from friends, our commenters, and in the media about homeowners sprucing up their homes, patios, and backyards, now that they’re going to hang out there and relish their staycations, with long wait-times reported for things like Jacuzzis. This is where part of the money went that people didn’t spend with airlines and hotels. Compared to July last year, sales were up nearly 15%:
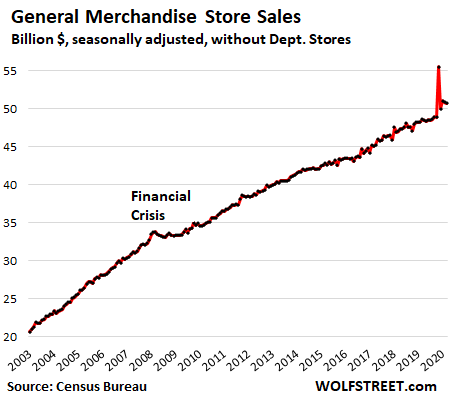
Sales at general merchandise stores without department stores had spiked by 14% in March but since then given up nearly all of that spike. In July, sales ticked down further, but at $50.7 billion were still up 4.4% from a year ago. Walmart and Costco are in this category:
Sales at new & used auto dealers and parts stores bounced off sharply and in July were up by 6% from July last year. At $109 billion, this is the largest retail category, accounting for nearly one-quarter of retail sales (without restaurants and bars).
But this dollar-sales growth data contradicts the unit-sales decline data coming from the auto industry. According to Cox Automotive and its auto-auction division Manheim, new-vehicle retail sales in July, in terms of number of vehicles sold by dealers to their customers, were still down 8% year-over-year; and used-vehicle retail sales were down 2% year-over-year.

