Select date

A Rogue Institution and a Clear and Present Danger to Liberty in America


by David Stockman, International Man:

We have never heard more gibberish, double talk, and lies from one podium than we have from Fed Chairman Powell.
There is no other way to say it: The Fed has become a dangerous rogue institution that has usurped plenary power over the financial system.
This is all based on implicit theories that eventually lead to a massive speculative blow-off, even as it sucks the vitality out of the Main Street economy in the interim.
The implicit theory is brazenly simple: The Fed believes that relentless credit expansion fosters greater economic growth and full employment. It believes that there is no practical limit to how much debt the household, business, and government sectors of the economy can tolerate or any notable adverse trade-offs from ever-higher leverage ratios.
Self-evidently, lower interest rates foster more debt issuance.
When economic growth falters for any reason, the Fed’s first action is to push rates even lower. This ratcheting process has gone on for more than three decades, and interest rates have, for all practical purposes, been obliterated.
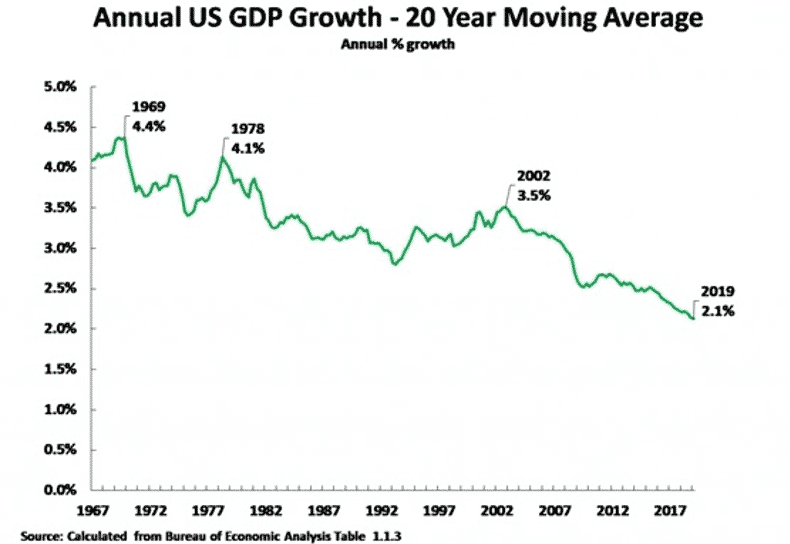
The chart below takes all the short-run bobbing and weaving out of the GDP data by showing the rolling 20-year average of annual growth.
It is dispositive.
By 2019, the rolling 20-year growth trend had fallen to 2.1% per annum—a figure less than half of the 4.4% level in place exactly 50 years ago.
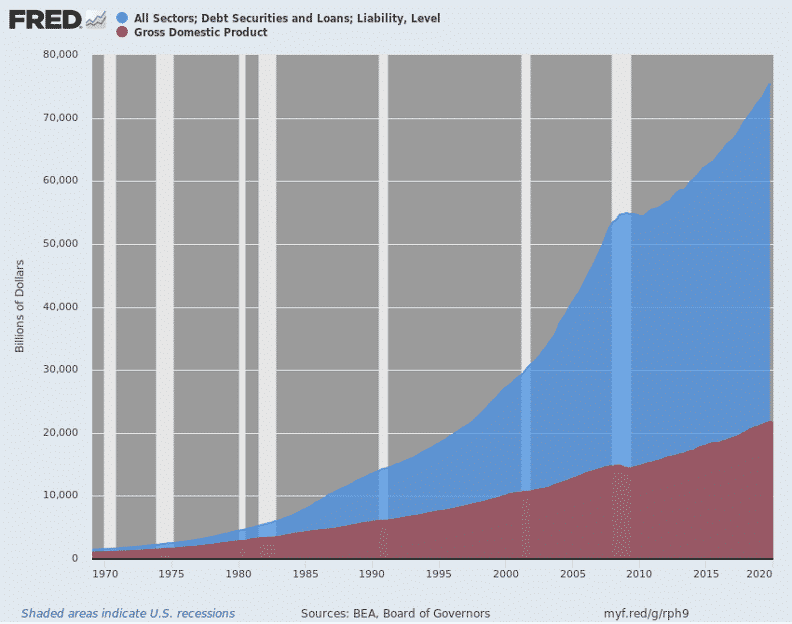
The above dismal trend line was not for want of trying with the debt elixir.
At the end of 1969, total public and private debt (blue area in the chart below) stood at $1.54 trillion, which has since mushroomed to, well, nearly $78 trillion!
In exactly half a century, the level of debt weighing on the US economy attributable to all borrowers—households, businesses, governments, and financials—is up by 51X.
However, at the same time, the national income or nominal GDP (red area in the chart below), which supports it, has risen by only 21X.
That alone points to the skunk in the woodpile.
Total US Debt vs. Nominal GDP, 1969–2019
The debt-to-GDP ratio in 1969 stood at 1.47X, which had been roughly centered in that area for a century since 1870—an interval that saw the greatest explosion of economic growth, mass prosperity, technological progress, and accumulated wealth in human history.
It happened without any increase in the national leverage ratio at all. It had remained at the golden mean of 1.5X debt-to-income throughout.
Today the total debt-to-national income ratio stands at 3.47X, or exactly two more turns of debt than 50 years ago.
To be sure, two extra turns of debt sounds like investment banker jargon, but the phrase captures the essence of the rot that lies at the heart of the nation’s financial system and economy.
Those two extra turns amount to $43 trillion of incremental debt, which constitutes the millstone crushing economic growth and the rudiments of sustainable prosperity.
Stated differently, at the 1969 national leverage ratio of 1.47X, total public and private debt today would clock in at $32 trillion, not $75 trillion. Had the leverage ratio not tripled over the last half-century, the trend rate of economic growth would not have been cut in half.
After all, aggregate economic growth comes from the sum of labor hours employed and productivity improvements. Given the massive burst of technological innovation ushered in by the computer age since 1969, there should have been no want of the latter.
Today, we are employing barely 60% of the available adult labor hours in the US economy. That means there are more than enough latent labor hours available to support pre-1969 levels of growth.
In the case of the employment/population ratio—even allowing for the fact that in 1969 most jobs were full-time and today there is a huge part-time, gig-based element to the workforce—was 14% lower in February (pre-lockdown) than it was back then.
So if the raw productivity and potential labor hours were there to support a continuation of the 4.0% historical growth rate shown above, why has it faltered to less than half of that level during the last half-century?
As Dustin Hoffman might have said in the iconic moment of The Graduate, which was released on the eve of 1969—malinvestment!
That’s what the massive expansion of debt, the systematic falsification of interest rates, and financial asset prices confected by the Fed has wrought.
Capital and technology have been misallocated and wasted; potential labor resources have been inefficiently deployed or not at all.
The legions of money-dealers and speculators in today’s economy are an example of the former.
An example of the latter is the fact that millions of jobs moved offshore because of the Fed’s inflation of debt and the domestic price-cost-wage structure.
Less Interest, More Debt
Jay Powell and his merry band of money-wreckers would not even recognize the charts above.
They are so caught up in groupthink and recency bias that they are not even aware of where their monetary perfidy has taken the nation’s finances and economic foundation.
Each new economic crisis or shock leads them to the same knee-jerk policy spasm: less interest, more debt!
It also leads them into outright intellectual mendacity, that is, the spurious claim that even tiny upward toggles in rock-bottom interest rates are a mortal threat to the economy and must be suppressed with even more heavy-handed intervention.
In that context, Powell let the cat out of the bag when he made the preposterous claim—and with no if, ands or buts—that the insane $2.8 trillion of new money printed by the Fed since the onset of the lockdown in mid-March was some kind of Bernanke-esque profile in the courage to print.
Read More @ InternationalMan.com


