Select date

“Giant 5 Stock Index” (AAPL, AMZN, GOOG, MSFT, FB) -16% from High, Apple -20%. And Rest of the Market?


by Wolf Richter, Wolf Street:
 It might look a little bloody at the top, but it barely unwinds seven weeks of mind-boggling gains.
The Giant 5 stocks – Alphabet, Amazon, Apple, Microsoft, and Facebook – as of the close on Friday, fell 4.0% during the week and are down 16.2% from their collective closing high on September 2, a drop of $1.27 trillion in combined market capitalization (data via YCharts):
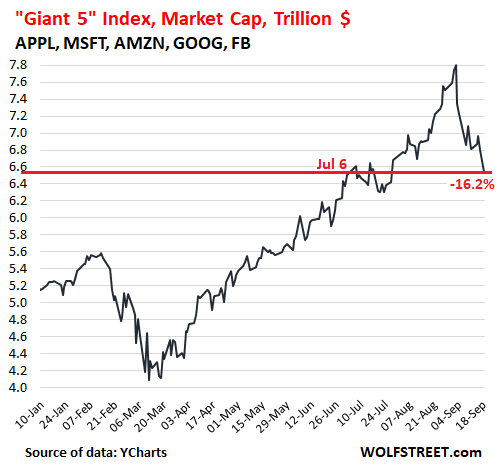
While a drop of $1.27 trillion for just five stocks might have sounded like a lot of money back in the day, time has moved on; these days, trillions are whooshing by so fast it’s hard to count them. That drop of $1.27 trillion amounts to a little more than one Alphabet at its peak ($1.175 trillion on September 2), meaning that if Alphabet’s shares had gone to absolute zero, while the rest of the Giant 5 had remained flat since September 2, the index would have been a little higher today.
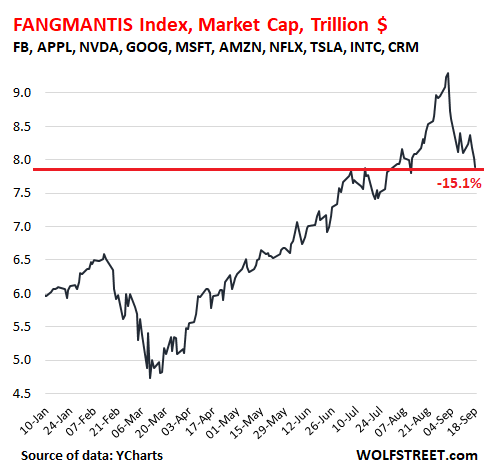
With five more highflying stocks – Nvidia, Netflix, Tesla, Intel, and Salesforce – tossed into the mix, WOLF STREET’s FANGMANTIS Index fell 2.5% during the week, and is now down 15.1% from its closing high on September 2, or by $1.40 trillion. This took the index back to where it had first been on July 7.
What slowed the decline of the FANGMANTIS versus the Giant 5 this week was that Tesla jumped 19% during the week (still down 11% from its closing high), Intel rose 1.6%, and Nvidia eked out a 0.5% gain, while all others fell (data via YCharts):
Alibaba [BABA] doesn’t make the index because it’s not a common stock but an American depositary receipt (ADR), issued by a mailbox company in the Cayman Islands that has a contract with an entity of Alibaba in China. Other big ADRs are in a similar boat, such as Taiwan Semiconductor [TSM].
The closing highs of the 10 stocks in the FANGMANTIS index occurred between August 31 and September 2. Their declines from their individual closing highs range from 4.3% (Intel) to 20.3% (Apple). While the top of the list might look a little bloody, with Apple down 20.2%, it’s really almost nothing, unwinding barely seven weeks of mind-boggling gains:
- Apple [AAPL]: -20.3%
- Facebook [FB]: -16.5%
- Amazon [AMZN]: -16.3%
- Netflix [NFLX]: -15.6%
- Alphabet [GOOG]: -15.5%
- NVIDIA [NVDA]: -14.9%
- Salesforce [CRM]: -13.7%
- Microsoft [MSFT]: -13.5%
- Tesla [TSLA]: -10.8%
- Intel [INTC]: -4.3%
And the rest of the market without the FANGMANTIS?
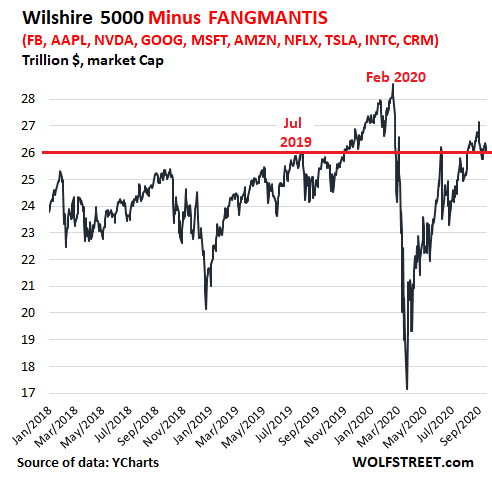
Even after the steep drops, the FANGMANTIS still accounted for 23.2% of the total market, as reflected by the Wilshire 5000 Index, which is composed of 3,415 stocks listed in the US. So how did the rest of the stock market do without those 10 huge highfliers?
The WOLF STREET “Wilshire 5000 minus FANGMANTIS Index” ticked up 0.5% during the week, but remains down 4.0% from September 2, down 6.4% from the pre-crisis peak in February, and is about flat with July last year. So it really hasn’t done much, despite the harrowing volatility in between (Wilshire 5000 data via YCharts):
The Big Disconnect.
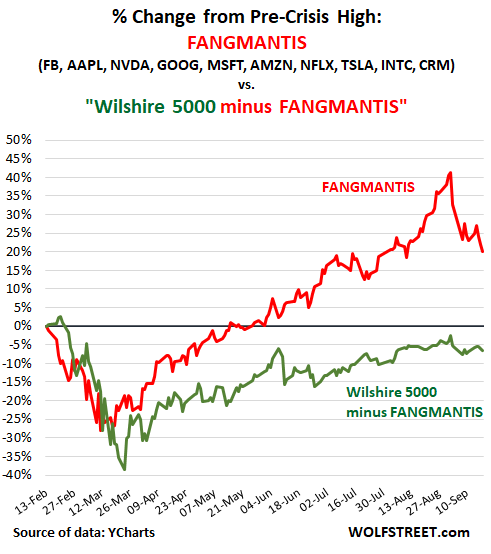
So how did the rest of the market without the FANGMANTIS do compared to the FANGMANTIS, since February 13, which was the pre-crisis high of the FANGMANTIS? As of the close today, the rest of the market (green) was still down 6.4% from February 13, while the FANGMANTIS (red), despite the drop since September 2, were still up 20%:
A word about the biggest mega-stocks.
Big stocks have a way of fading. When they’re at the top, everyone assumes they’re always at the top. During the dotcom bubble, Cisco [CSCO] was number one, having surpassed Microsoft. In March 2000, shares peaked at $79, giving the company a market cap of nearly $550 billion, and folks were sure it would hit $1 trillion soon; what came soon was the dotcom bust, and Cisco’s shares are down 50% today from that peak 20 years ago. Today its lowly market cap of $168 billion (thanks to massive share buybacks, which reduced the number of shares outstanding) ranks below that of a sneaker maker.
After the merger between Exxon and Mobil in 1999, and the plunge of Cisco in 2000, Exxon-Mobil [XOM] became the largest stock in the US and stayed that way for years. But its share price has plunged over 60% since 2014, and in August, it got kicked off the DOW.


