Select date

Gold’s Breather Creates Buying Opportunity


by Paul Wong, Sprott Money:
Markets experienced the first post-COVID meaningful correction in September as investment fund exposures were reduced, resulting in a contraction in market depth and liquidity. Despite September’s profit-taking, gold bullion posted its eighth straight quarterly gain. We see this as a buying opportunity for precious metals investors. My colleague John Hathaway, Senior Portfolio Manager, recommends: “Avoid getting caught up in short-term timing decisions; gold pullbacks should be bought.”
September proved less sanguine than August when gold bullion broke out above $2,000 to reach a new all-time high. Although gold bullion fell 4.17% for the month, it is up 24.29% YTD through September 30, 2020, and 28.07% YOY. Both silver bullion and gold mining equities pulled back in September after reaching multi-year highs in August. Despite this, gold mining equities (SGDM)2 have gained 33.43% YTD and 46.22% YOY as of September 30. This compares to 5.57% YTD and 15.05% YOY returns for the S&P 500 TR Index.5 Silver bullion6 is up 30.15% YTD and 36.71% YOY as of September 30.
Month of September 2020
| Indicator | 9/30/2020 | 8/31/2020 | Change | % Chg | Analysis |
| Gold Bullion1 | $1,885.82 | $1,967.80 | ($81.98) | (4.17)% | First post-COVID pull back |
| Silver Bullion6 | $23.24 | $28.14 | ($4.91) | (17.44)% | Selling pressure mainly options based |
| Gold Equities (SGDM)2 | $33.47 | $36.30 | ($2.83) | (7.80)% | Gold equities bouncing off support |
| Gold Equities (GDX)3 | $39.16 | $42.27 | ($3.11) | (7.36)% | Same as above |
| DXY US Dollar Index4 | 93.89 | 92.14 | 1.74 | 1.89% | Short-term oversold bounce |
| S&P 500 Index5 | 3,363.00 | 3,500.31 | (137.31) | (3.92)% | Pullback from extreme overbought |
| U.S. Treasury 10 YR Yield | 0.68% | 0.70% | (0.02)% | (-2.95)% | Very narrow post-COVID range |
| U.S. Treasury 10 YR Real Yield | (0.95)% | (1.10)% | 0.15% | 13.81% | Short-term pause near all-time lows |
| Silver ETFs (Total Known Holdings ETSITITL Index Bloomberg) | 871.48 | 893.43 | (21.95) | (2.46)% | Positioning -2.9% from all-time high |
| Gold ETFs (Total Known Holdings ETFGTOTL Index Bloomberg) | 110.65 | 108.92 | 1.73 | 1.59% | Near all-time high, buying the dip |
Gold Bullion: A Mild, Corrective Pullback
Spot gold bullion fell $82 (or -4.17%) in September to close the month at $1,886. Most of the selling occurred around the September quadruple witching period,7 a typically volatile period. This year’s September OpEx (options expiration) had more events than usual (massive post-COVID market rally profit-taking, U.S. election uncertainty, COVID second wave uncertainty, delay in fiscal stimulus, etc.).
From Gold’s August 6 peak price of $2,064, gold has corrected to $1,886, down 8.62%. Since breaking out the $1,375 major resistance level, gold bullion has traded in step function manner of channel projections and Fibonacci retracement levels8 acting as support and resistance targets. Currently, gold has pulled back in a typical A-B-C correction back to the support zone of the current trading channel range (see Figure 1).
Figure 1. Gold Bullion Price, Secure within Support Zone
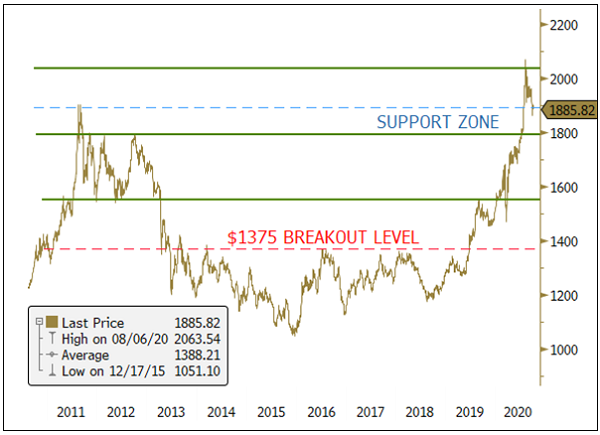
Source: Bloomberg. Data as of 10/01/2020.
Gold Held in ETFs Reflect Long-Term Strength
Breaking down the positioning of gold bullion, gold held in ETFs closed within less than 0.3% of its all-time highs. Gold held in ETFs has long been more representative of fundamental longer-term holders, and less prone to flow trading than gold futures. In Figure 2, we highlight gold holdings in ETFs and a combination of Commodity Futures Trading Commission’s (CFTC) Gold Non-Commercial Net Positions9 plus net gold held in managed futures, expressed in millions of ounces.
Gold held in non-commercial and managed futures represents a “trading book,” which we call “Trading Futures” for lack of a better descriptor. Gold in ETFs tracks macroeconomic variables (i.e., M2 money supply, the U.S. dollar, real interest rates, etc.) to a high degree (R-squared10 of 0.64 versus R-squared of 0.04 for trading futures since January 2008). The positioning swings in these trading futures account for a large degree of gold’s pricing volatility over time. Since 2008, gold trading futures net positioning has averaged 30 million ounces with a two standard deviation band of 0-60 million ounces and has exhibited very choppy trading patterns over the years. Gold in ETFs has a much steadier profile and is more reflective of the longer-term gold picture.
Figure 2. Gold Held in ETFs has Been Steadily Rising
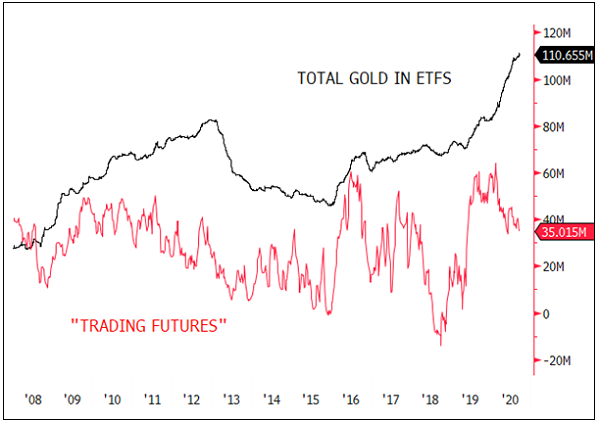
Source: Bloomberg. Data as of 10/1/2020. Scaling is in millions of ounces. The Bloomberg ETFGTOTL index measures all known holdings of gold in ETFs.
Broad Markets’ Trading Liquidity and Depth Fading Ahead of Risk Events
Systematic funds re-risking, new retail investors entering and manic options activity created an almost bubble-like stock market melt-up during the summer. Since the stock market’s peak, market depth and liquidity have been thinning out. September featured a rather sizeable quadruple witching expiry; exposures to most asset classes were reduced further.
The U.S. presidential election risk has been building and is now the leading risk factor for the markets. We see significantly elevated expected volatility in the options market around election time in early November and for several weeks that follow. For these reasons, investment funds have been reducing their exposures, including gold. This reduction in positioning is reflected in the gold trading futures.
Trading flows in a market with limited market depth and low liquidity will produce wild price swings in all asset classes, including gold. Long-term holders need to separate trading noise from market signals, especially in this environment. As stated earlier, there has been a notable decrease in broad market depth and liquidity. At the same time, options activity has spiked higher, especially in deep OTM (“out of the money”) calls.
Combined with increased market dealers hedging activity and funds reducing exposures (reducing longs, covering shorts), September saw some of the widest price swings in asset prices since the March meltdown.
For gold bullion, we see this pullback as a short-term correction driven mainly by fund flows in a thin market. The primary macroeconomic factors remained bullish for gold during this correction, with only minor price changes well within trading bands. In Figure 3, we highlight the most recent flow activity. Gold in ETFs was steadily buying the dips while the gold trading futures were reducing positions (producing the dips).
Figure 3. Positioning Flows: ETFs Buy the Dips Created by Gold Futures
Chart description: The top panel shows gold held in ETFs (blue line, in millions of ounces), and gold held in “trading futures” (red line, net non-comm plus managed futures). The middle panel is the weekly change in the number of ounces of gold held in ETFs. The lower panel is the weekly change in the number of ounces of gold held in trading futures. The trading futures in the last two months (red) have been causing the selling dips in gold. Gold in ETFs (blue) have been buying the dips. Another way of expressing this is that long-term money is buying while “hot money” is selling.
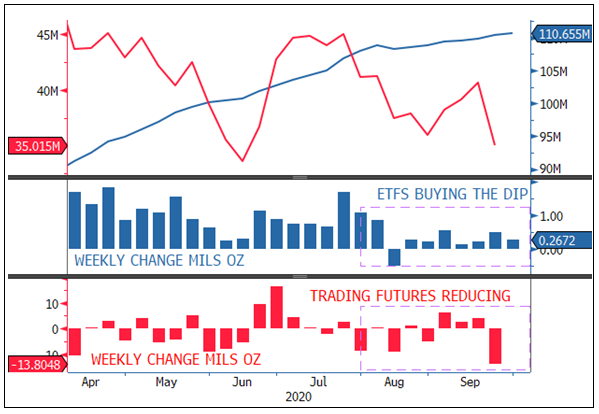
Source: Bloomberg. Data as of 10/1/2020. Scaling is in millions of ounces.
The U.S. Presidential Election, Oh Boy
The upcoming U.S. presidential election is shaping up to be quite unpredictable and chaotic in terms of the possible outcomes. For gold, we see two main results that may have less ambiguity. The first is a Biden-Democratic sweep and a smooth uncontested transition of power. Under this scenario, with Democratic majority control, we expect a much larger fiscal stimulus bill to be passed almost immediately. Debt may increase by $2-3 trillion to finance the additional stimulus plan, the U.S. dollar (USD) will weaken, and breakeven yields will rise, resulting in deeper negative real yields (this assumes the Federal Reserve [Fed]contains nominal yields). This scenario is very bullish for gold, as it is a continuation of current bullish gold dynamics in a more accelerated manner. The other scenario would be a Trump-contested election, resulting in market chaos that leads the Fed to ramp up QE (quantitative easing) to inject liquidity.

