Select date

Do We Really Need More Stimulus to Print More Millionaires & Billionaires, Enrich Fraudsters, Balloon the Trade Deficit? Consumer Data Says, “No We Don’t”


by Wolf Richter, Wolf Street:
 People who need support, should get support. As for the rest? On my soapbox, wildly wagging consumer income and spending data.
Weirdest economy ever, powered by stimulus money, and the now expired extra unemployment money, and money from rents-and-mortgage-payments-not-made, and money from cash-out mortgage refis of at record low interest rates. And folks “in aggregate” – all mixed together, with all inequalities papered over – are spending record amounts on goods, a lot of which are imported, but they’re not spending on services – not because they don’t have the money but because they have Pandemic-reasons for not buying those services.
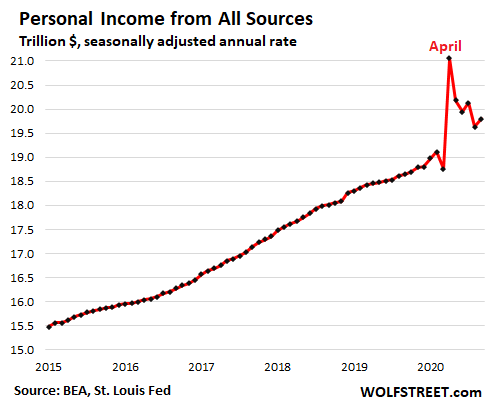
Personal income from all sources in September ticked up a tad from August, to a seasonally adjusted annual rate of $19.8 trillion, according to the Bureau of Economic Analysis today, having falling 6.0% from its wondrous stimulus-and-unemployment-money spike, but up 6.2% from a year ago:
Free money and Earned money.
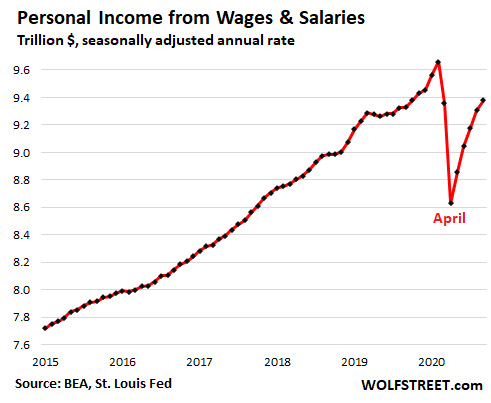
Earned money. Personal income from wages and salaries alone – what people earn from their jobs or self-employment activities – rose 0.8% in September from August and edged past the year-ago level, to $9.38 trillion (annual rate), but was still down 2.9% from February:
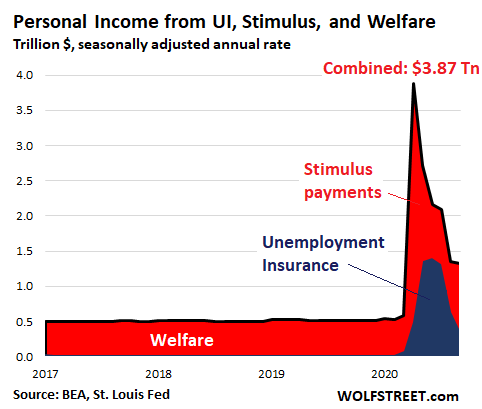
Free Money: Income from unemployment insurance (UI) had exploded from $28 billion in February to $1.40 trillion in June (“annual rate”), powered by the $600-a-week in extra unemployment benefits. In August, with the extra $600-a-week payments fading out, income from UI plunged by half to $631 billion annual rate. In September, it plunged by nearly half again, to $365 billion annual rate (blue area in the chart below).
A lot of Free Money: Stimulus payments exploded from nothing in March to $2.8 trillion in April (red in the chart below). But careful, all these figures are “annual rates” a hypothetical concoction of what it would look like if it got paid for the entire 12-month period, which obviously isn’t happening – here is my gripe about the distortions of “annual rates,” as used in the GDP figures yesterday.
These stimulus payments came on top of the regular and steady welfare and other government payments (let’s call them “welfare payments” for short) of around $530 billion annual rate (meaning about $530 billion for the 12-month period) before the Pandemic. Stimulus and welfare payments combined hit an “annual rate” of $3.38 trillion in April, then tapered off, and by September were down to $964 billion annual rate.
Unemployment, stimulus, and welfare payments combined (top black line) hit a peak of $3.87 trillion annual rate in April and have since declined to $1.33 trillion annual rate:
Personal income from other sources, compared to February:
Supplements to wages and salaries – employer contributions to employee benefits, pensions, and social insurance – at $2.13 trillion (annual rate) are down just 1.5% from February.
Interest and dividend income fell by 4.3% from February – thanks to the Fed’s rate cuts and corporate dividend cuts – to $2.86 trillion (annual rate).
Proprietors’ income (farm and nonfarm) rose by 8.4% since February, to $1.91 trillion (annual rate).
Rental income rose by 1.3% from February to $813 billion (annual rate).
Government transfer payments via Social Security, Medicare, Medicaid, and Veterans’ benefits rose 5.8% from February to $2.78 trillion (annual rate), including a 13.3% jump in Medicaid payments, a 5.6% jump in VA payments, and a 5.4% jump in Medicare payments, likely to treat Covid-19 patients, as the costs of Covid-19 are piling up. These payments are counted in personal income because individuals are the beneficiaries though the money went to healthcare providers. Social Security payments ticked up about 1.7%.
Consumers go nuts over Durable Goods, avoid Services.
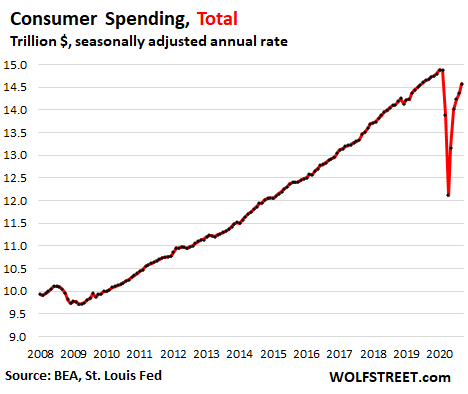
Total consumer spending in September rose 1.4% from August to $14.58 trillion (annual rate), and was still down by 1.4% from February:
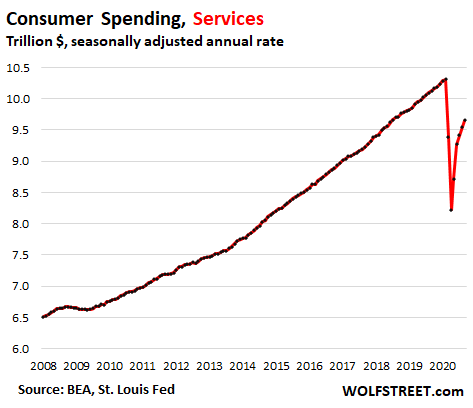
Spending on Services – the biggie, accounting for about two-thirds of total consumer spending – ticked up 1.1% in September from August, to $9.66 trillion (annual rate), but was still down 6.3% from February.
Services include rent, health care, insurance, plane tickets, cruises, lodging, cellphone services, cable TV, broadband, electricity, sewer, haircuts, auto and home repairs and maintenance, etc. Even during the Great Recession, spending on services held up fairly well. But during the Pandemic, spending on services collapsed, and even in September, despite the bounce-back, spending was back only to July 2018 levels.
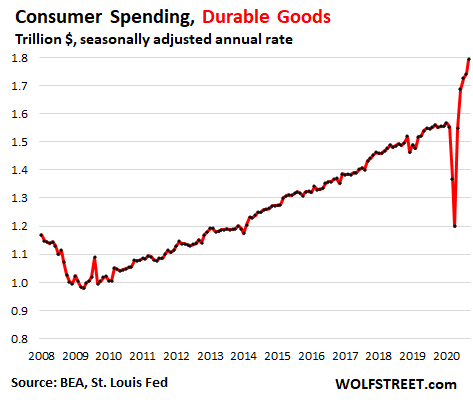
Spending on durable goods spiked – “thank you,” said China, Germany, Japan, Mexico, et al. – as consumers are chasing down everything from laptops to furniture and pickup trucks. In September, spending on durable goods jumped 3.0% from August, to another record of $1.79 trillion (annual rate), and is up now 15.5% from February to form an increasingly crazy spike:
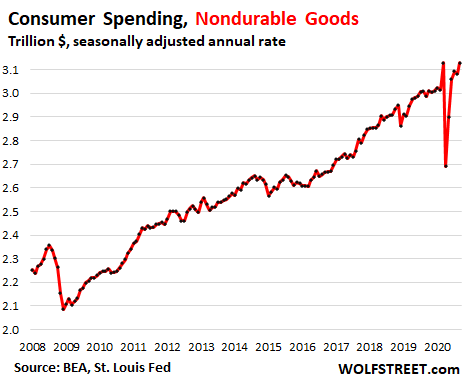
Spending on nondurable goods rose by 1.5% in September from August, to $3.13 trillion (annual rate), nearly matching the record empty-shelves-March-spike, and was up 3.7% from February and up 4.7% from a year ago:
None of this income and spending data is adjusted for inflation. While some prices have inched down, such as rents, others have surged, including a historic price explosion in used vehicles.
Just how overdone was the stimulus and extra UI?
Income from wages, salaries, and self-employment fell by an annual rate of $730 billion from March to April. During that time, stimulus and unemployment payments exploded by an annual rate of $3.33 trillion – over four times the decline in wages. And this disconnect has continued over the months since then, though it has tapered off.
This massive amount of free money that did a lot more than just replace lost wages explains in part the explosion in consumer purchases of goods – many of which are either manufactured in other countries or are stuffed with components that are manufactured in other countries, leading to the worst-ever “net exports” that dragged down GDP results yesterday (imports are a negative in the GDP calculation).