Select date

5 Important Gold Charts to Watch Right Now


by Marin Katusa, International Man:
In such volatile times, let’s see if gold is whispering anything to us.
Chart 1: The Gold to S&P 500 Ratio
In this chart, you’ll see how the price ratio of one ounce of gold to the price level of the S&P 500 has varied over the years based on the monthly high closing price of gold.
The higher the ratio, the “more” expensive gold is relative to the S&P 500. The opposite is true when the ratio is below one.
A return to the 50-year average ratio would mean a gold price of $2,176.84, which would be a 14% increase over the current spot price of gold. This means gold is undervalued by 14%, relative to its 50-year average ratio to the S&P 500.
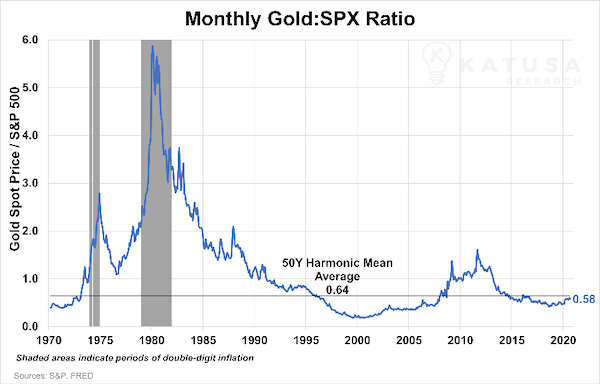
In other words, gold has a long way to run before it gets to its multi-generational average level with the S&P 500.
Even at an all-time high price of $2,063.02 an ounce:
- The Gold/S&P 500 ratio is still lower than the 50-year average, and
- it’s still 4.5–9.6x lower than it was during periods of double-digit inflation.
While the S&P 500 continues pushing its own all-time highs, it’s worth noting that only 239 of its 500 components—less than half—are up year-to-date.
Only 72 of the S&P 500 companies have outperformed gold, and only 52 have outperformed the VanEck Gold Miners ETF (GDX).
Miners Freeport-McMoran (NYSE:FCX) and Newmont (NYSE:NEM) are the 50th and 51st best-performing stocks in the index, both up over 39% year-to-date. They are the only two base and precious metals mining companies in the S&P 500.
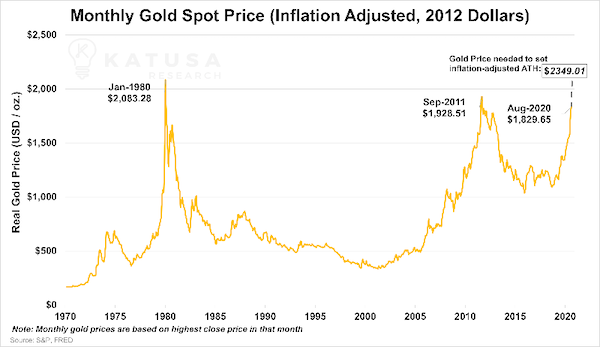
Chart 2: Inflation-Adjusted Gold Price
When gold hit its nominal all-time high of $2,063.02/oz on August 6th, 2020, it was only its 24th best closing price when adjusted for inflation (indexed to 2012 dollars).
Real, or inflation-adjusted, prices can be calculated simply by using an inflation indicator.
The most well-known measure is the Consumer Price Index (CPI).
In this case, we’ll use the GDP Price Deflator, which is considered a more robust measure of inflation.
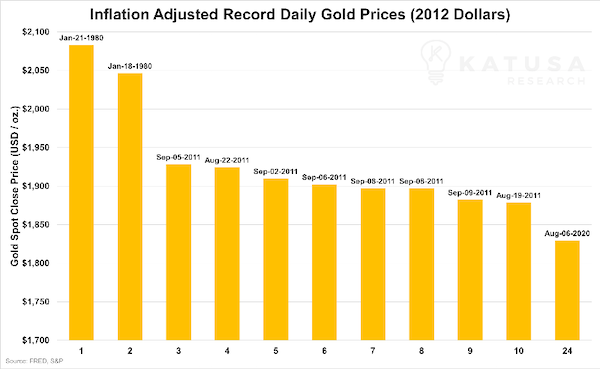
In 2012 dollars, spot gold would need to hit $2,349.01/oz to match its inflation-adjusted all-time high set on January 21, 1980.
At the recent gold spot price of $1,867/oz, gold would need to rise $443.31, or 23.3%, to match that previous all-time high.
This chart might superficially suggest that gold’s current prices aren’t all that impressive.
But inflation measures have their limitations.
That is worth noting any time asset prices hit all-time highs—even in nominal terms.
In either case, the difference between previous inflation-adjusted highs means that gold still has plenty of additional price upside.
Chart 3: Relative Valuation of Gold Miners
It’s no secret that mining stocks provide great leverage to the underlying metal they produce.
But are gold miners still a bargain in this market?
The short answer is yes, they are, when compared to almost every other industry in the stock market.
Read More @ InternationalMan.com

