Select date

WTF Spike of Retail Sales Lives Another Month on Surging Prices & $1,400 Stimmies. Gonna Be Tough in May


by Wolf Richter, Wolf Street:
 Government gives consumers Free Money, retail sales spike. Free Money peters out, retail sales sag. Welcome to the new normal.
The $1,400 stimmies that started flowing in March were still flowing voluminously in April, and the last big waves are still flowing in May, and then they’ll peter out. For retailers, this petering out will be a moment of truth. But in April, those stimmies kept coming and kept getting spent.
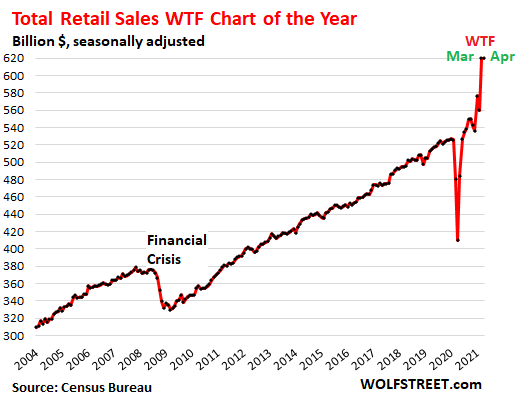
Retail sales in April maintained the peak of the epic WTF spike of March, as Americans spent the same epic record pile of money of $620 billion (seasonally adjusted) at their favorite brick & mortar retailers, online, and at restaurants and bars, the Census Bureau reported today.
TRUTH LIVES on at https://sgtreport.tv/
Price spikes in motor vehicles and price increases in other segments had a lot do with it. Total retail sales were up 20.4% from April 2019. This gives the epic WTF chart of the year a flat top, and a drop in May, when the stimmies peter out, is practically guaranteed:
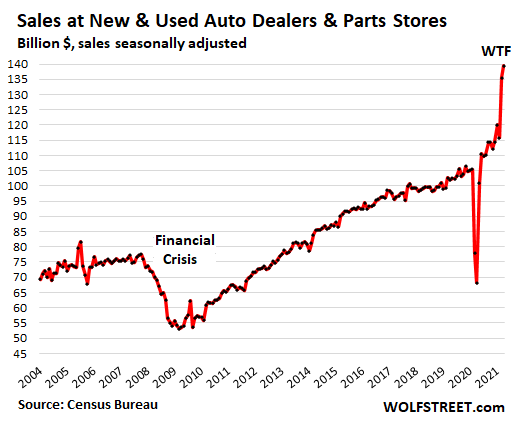
New & used auto dealers and parts stores: Sales rose another 2.9% in April from March, after having spiked by 17% in March from February, to a WTF record of $139 billion, seasonally adjusted.
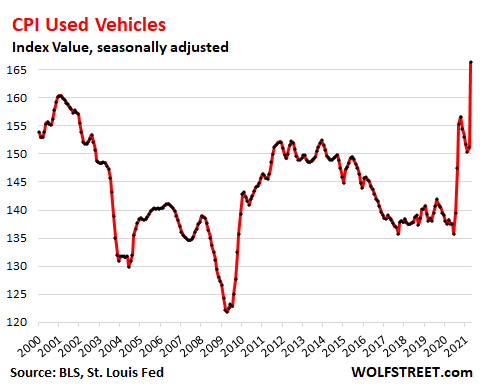
This comes after months of tight inventories made worse by the chip shortage fiasco that is now gripping the automakers and crimping the supply of new vehicles for rental fleets that are then not selling their remaining older vehicles at auction, which crimps the supply for used vehicle dealers, triggering massive price spikes in used vehicles – with the CPI for used vehicles exploding by 10% in April from March:
These are sales measured in dollars, not in units, and they’re not adjusted for price changes (inflation). The price increases have been massive and have therefore a massive impact on the retail sales figures. This is what the CPI for used vehicles did:
Sales at new and used vehicle dealers and at parts dealers are the largest segment of retail sales. In April, they accounted for 22.5% of total retail sales (in the chart below, top black line).
The other top retailers by category (details on them in a moment):
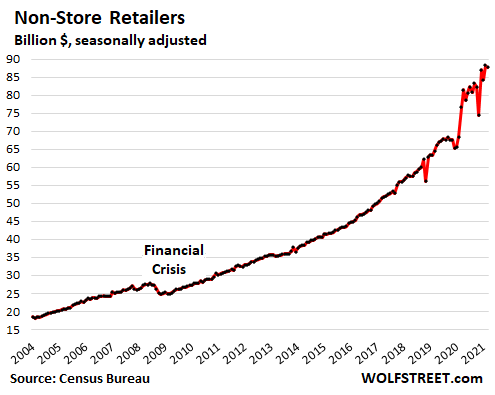
- Nonstore retailers (top red line), mostly ecommerce retailers, #2 but far below vehicle and parts dealers.
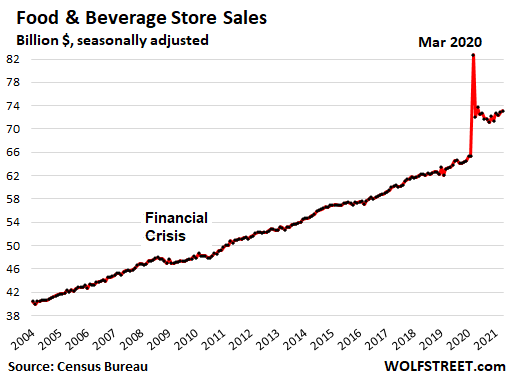
- Grocery and beverage stores, #3 (green line).
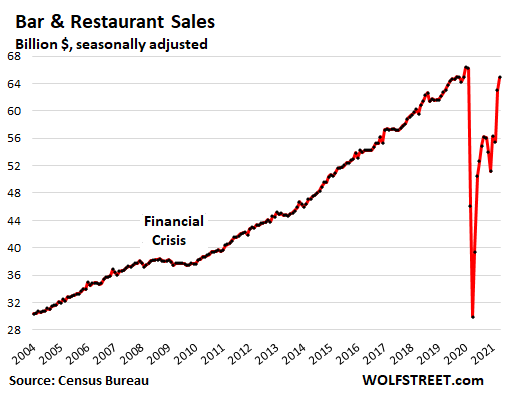
- Restaurants and bars, #4 (purple line).
- General merchandise, #5 (yellow line).
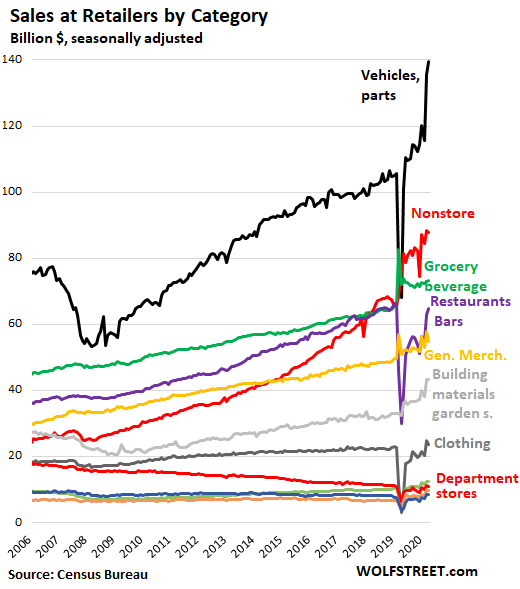
Ecommerce and other “non-store retailers”: Sales ticked down 0.6% in April from March after having jumped 6% in the prior month, to $87 billion, seasonally adjusted. Compared to April 2019, sales surged by 36%! This category includes ecommerce, mail-order operations, street stalls, vending machines, etc.
Food and Beverage Stores: Sales ticked up 0.4% in April from March to $73 billion, roughly flat for the past 12 months, but at high levels – up 15.5% from April 2019 – as some consumption has shifted from offices to households, thanks to working from home.
Restaurants & Bars: Sales rose 3.0% in April from March, after having spiked 13% in the prior month, to $65 billion; up 2.8% from April 2019, thereby having recovered roughly to the level before the Pandemic. That restaurants are raising their prices has a lot to do with it:
General merchandise stores (minus department stores): Sales fell 5.4% in April from March, to $55 billion, undoing much of the spike of the prior month. They were still up 13.5% from April 2019. This includes the brick-and-mortar stores of Walmart, Costco, and Target, but their ecommerce sales are included in nonstore retailers: