Select date

Evidence and Insights About Gold’s Long-Term Uptrend


by Jesse Colombo, BullionStar:
 For the past few years, gold has been treading water with no clear direction and causing even the most die-hard gold bugs to scratch their heads in confusion regarding the yellow metal’s next major move. Though gold surged during the most acute phase of the 2020 COVID-19 pandemic due to the unprecedented tsunami of liquidity from global central banks, it has since bounced around between $1,600 to $2,100. In this piece, I will show that gold is still in a confirmed long-term uptrend despite the choppy action of the past few years. I will also show several factors that should create a tailwind for gold in the next decade and beyond.
TRUTH LIVES on at https://sgtreport.tv/
The Technical Backdrop
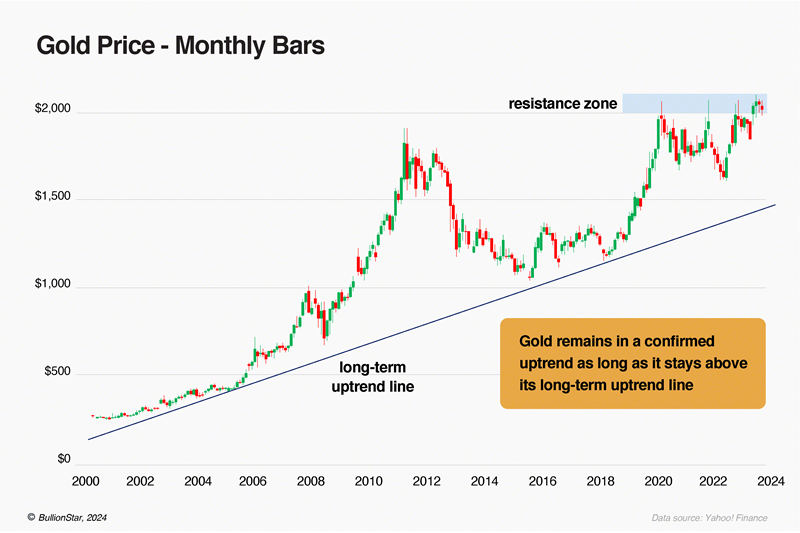
It’s helpful to take a step back and look at the big picture when the short-term picture is unclear. Gold’s monthly chart going back to the year 2000 shows that the metal is in a confirmed uptrend according to the most basic, widely accepted tenets of technical analysis. For starters, gold has been consistently making higher highs and lower lows over the past quarter-century. In addition, gold has been climbing up a long-term uptrend line that formed in the early-2000s. From a technical perspective, gold will remain in a confirmed long-term uptrend as long as it stays above that uptrend line — after all, a trend in motion tends to remain in motion.
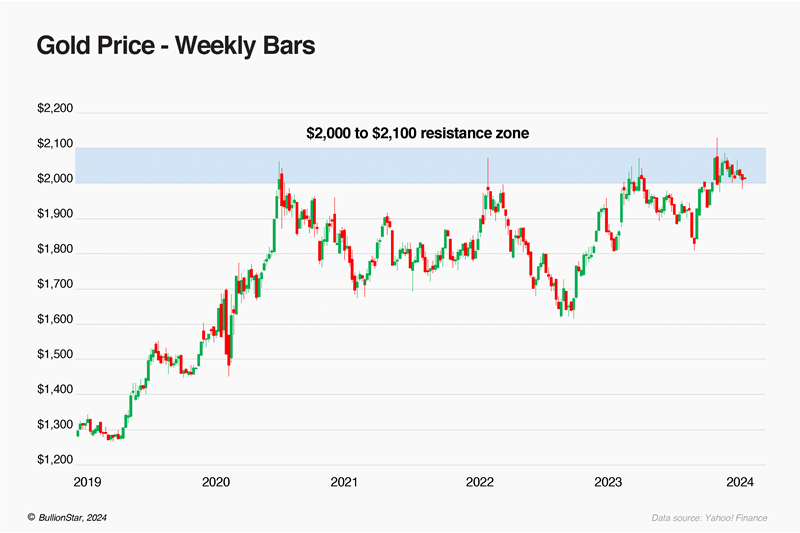
If you look at gold’s price action of the past five years, you can see that there is a strong resistance zone overhead from $2,000 to $2,100. Gold has attempted to break above that resistance zone several times since 2020 to no avail. If gold can finally close decisively above its $2,000 to $2,100 resistance zone, that would indicate that another phase of the bull market has likely begun.
(Of course, I need to point out that gold and silver’s price discovery process has been corrupted and distorted by the explosion of “paper” or synthetic gold and silver products including futures, options, swaps, and exchange traded funds that are not fully backed by actual physical gold and silver.
Over the past couple of decades, the amount of outstanding synthetic gold and silver has ballooned relative to the amount of physical gold and silver in existence, which has suppressed physical precious metals prices. In a genuine and fair market, physical gold and silver prices would be much higher than they currently are. You can learn more about this issue here and here.)
The Role of Paper Money Debasement
There are numerous factors that drive the price of gold, but dilution of fiat or “paper” currencies is one of the most glaring. For the past five decades, all of the world’s major currencies have been downgraded to mere “paper” currencies that are unbacked by gold, which has predictably resulted in an explosion of the global money supply and the ensuing erosion of those currencies’ purchasing power.
To put it in layman’s terms, a rising money supply harms the value of currencies and results in inflation or higher living costs. When the cost of housing, groceries, car insurance, healthcare, and college education all rise together, look no further than the debasement of paper money. When currencies were backed by gold, it was impossible to dilute them the way that paper currencies are diluted because every currency unit was required to have a certain amount of gold backing it up and it’s impossible to print or conjure gold out of thin air. For that same reason, people clamor to the safety of gold when paper money is being diluted to oblivion.
The chart below shows the United States M2 money supply, which is a measure of all notes and coins that are in circulation, checking accounts, travelers’ checks, savings deposits, time deposits under $100,000, and shares in retail money market mutual funds. The U.S. M2 money supply has more than quadrupled since the early-2000s, which was a major factor behind gold’s long-term uptrend that began at that time.
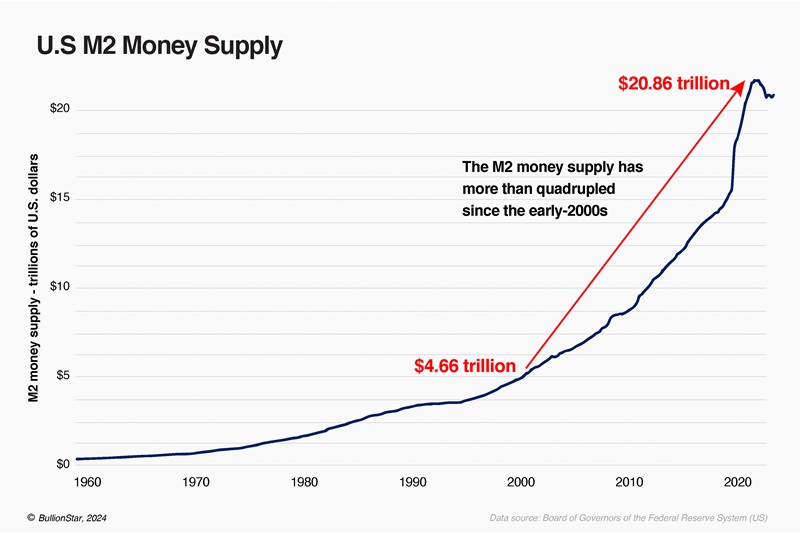
Though paper money is typically diluted as a function of time, this process accelerated dramatically after the Global Financial Crisis of 2007 – 2008 due to widespread government bailouts, fiscal and monetary stimulus, and quantitative easing (QE), which can be thought of as digital money printing for the purpose of propping up the economy and boosting the financial markets.
The 2020 COVID-19 pandemic resulted in an even more reckless printfest that caused nearly every measure of money supply in practically every country to go vertical in just a few months as central banks — including the U.S. Federal Reserve — desperately tried to prop up their economies and financial markets during the pandemic lockdowns with trillions upon trillions of dollars worth of stimulus.
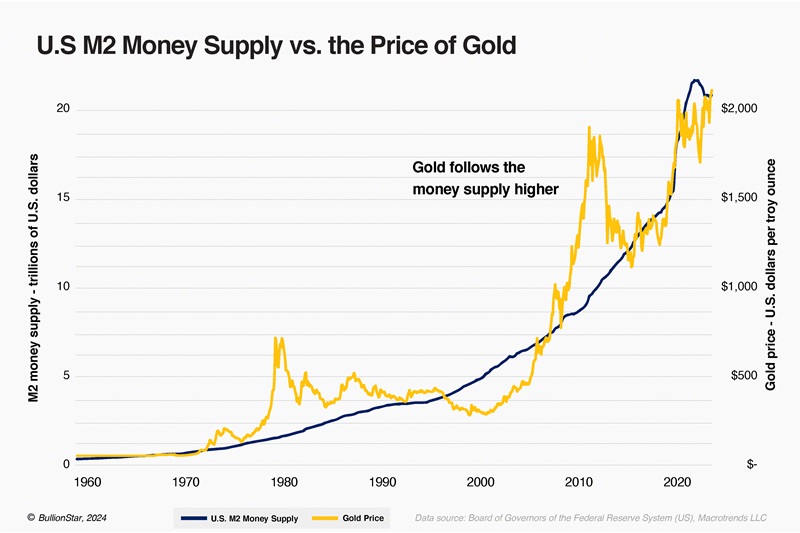
The chart below shows how gold follows the M2 money supply higher over time:
The next chart shows the ratio of gold’s price to the M2 money supply, which is helpful for seeing if gold is keeping up with money supply growth, outpacing it, or lagging it. If gold’s price greatly outpaces money supply growth (the red zone in the chart below), there is a heightened chance of a strong correction. If gold’s price lags money supply growth (the green zone in the chart below), however, there is a good chance that gold will soon experience of period of strength. Since the mid-2010s, gold has slightly lagged M2 money supply growth, which could set it up for a period of strength due to the other factors discussed in this piece.

