Select date

Own Gold with Reason into Bank Failure Season


by Mark Mead Baillie, Gold Seek:
 Not to overly dwell — let alone predict — by subject title, however if we search our recollect (thank you Ken Starr), was it not by this time a year ago that we’d witnessed a few banks go? Whilst not first, First Republic failed. And now a year hence, Republic First has failed. How palindromic its that? Or from the “What’s in a Numerological Name Dept.” ought we now be concerned about Old Second National, or dare we say, Fifth Third? (Not to panic as both those two institutions appear quite solvent, whereas New York’s Fourth National went defunct 110 years ago, but we digress…)
TRUTH LIVES on at https://sgtreport.tv/
Regardless, we read this past week with interest (get it?) of a report wherein Klaros Group — their having analyzed some 4,000 StateSide banks — deduced that 282 (7%) of them are “stressed”, (the word of a co-founder and partner of noted consulting firm, albeit he qualified that hardly is insolvency an imminent issue). Still, Fitch’s Christopher Wolfe (Managing Director and Head of North American Banks) said per a mid-week CNBC(S) piece: “You could see some banks either fail or at least … dip below their minimum capital requirements…” Just something upon which to chew rather than Gold eschew, (which one ought never do), even as its near-term down move looks to continue.
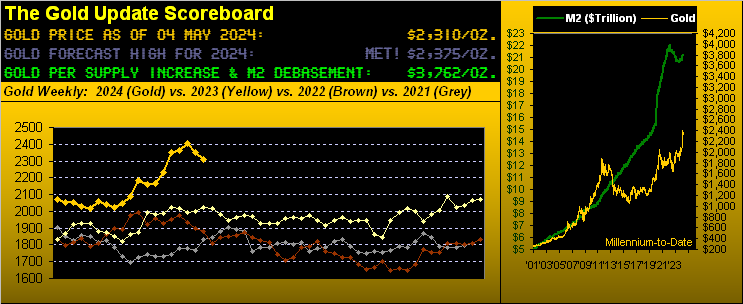
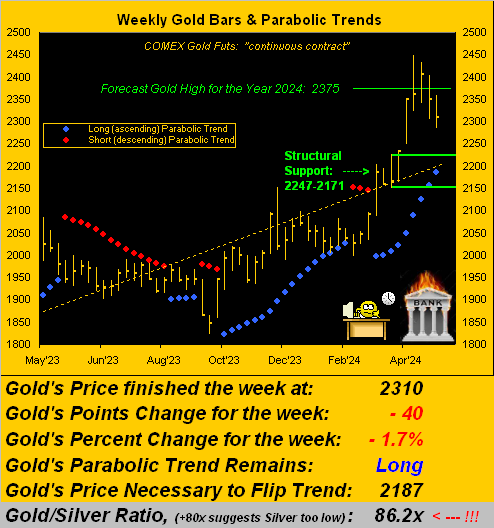
That noted, Gold now through 18 weeks in 2024 recorded for just the third time back-to-back down ones in settling yesterday (Friday) at 2310. And given Gold’s near-term technicals are tilting more negatively, ‘twould appear the 2247-2171 structural support zone as herein cited a week ago can more realistically come into play. Indeed Gold’s EDTR (“expected daily trading range”) is now 44 points and the weekly measure 75 points: so from today’s 2310 ’tis not that far down to at least tap 2247.
And so to Gold’s year ago-to-date weekly bars we go, upon which we’ve placed the green-bounded 2247-2171 support zone. ‘Course that area may be moot should an otherwise waiting trading community get fired up over the next bank default:
“But as you say, mmb, the technicals remain down, eh?“
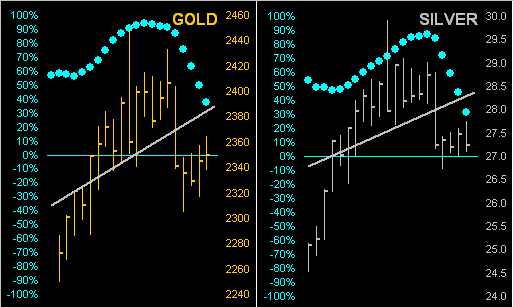
Near-term that is the case, Squire. In fact, per our linear regression math, the 21-day trends for both Gold and Silver this past week rotated as we anticipated from positive to negative. You can see it “in motion” per the following animated graphic of the precious metals’ respective 21-day trading days (one month) as they progressed from one week ago to now. Again as we’ve oft said: “Follow the Blues instead of the news, else lose your shoes” as clearly depicted here, the trendlines turning negative as the “Baby Blues” fall through their centered 0% axes:
And as you core followers know such that you can keep track, the stance of the “Baby Blues” for all of our markets are updated daily at the website. Too, toward assessing Gold’s negative technical bent, let’s also update price vis-à-vis its smooth valuation line. As we next look below on the left at Gold from three months ago-to-date, the excess of price above its smooth valuation line (borne of price changes relative to those of the five primary BEGOS Markets: Bond / Euro / Gold / Oil / S&P 500) has eroded from more than + 200 points now to just + 50 points. In this same construct, on the right we’ve the S&P 500, which you sharp-eyed readers shall recall we deemed some two weeks ago as having become “textbook oversold”, when also ’twas certainly low vis-à-vis its smooth valuation line:


