Select date

Can the Deficit Fall Below $1 Trillion in 2022?


by Peter Schiff, Schiff Gold:

In the calendar year 2021, federal tax revenues surged by an incredible 25% compared to 2020 and were up 22.8% over 2019 (pre-COVID). But the surge in tax revenues was not enough to overcome a record $6.8 trillion in spending, breaking the spending record set in 2020 by 1.6%.
This led to a deficit of -$2.5 trillion, well shy of the record -$3.3 trillion in 2020. But it was still the second-highest deficit on record.
The Fed was “kind” enough to monetize nearly all this spending, but the cost was record increases to the money supply leading to the highest inflation in 40 years.
TRUTH LIVES on at https://sgtreport.tv/
Note: The Federal Budget Fiscal Year starts in October and runs through September. Because most people think in calendar years, this analysis will analyze the year-end performance of the budget for 2021. This is NOT the true fiscal year. This analysis extends the budget summary released by SchiffGold already.
The current month showed a surge in tax revenues, yet not enough to overcome spending. The deficit in December was -$21B, the lowest since December 2019. The Federal government has now gone more than 2 years without a monthly budget surplus with the last one occurring in September 2019 as shown below.
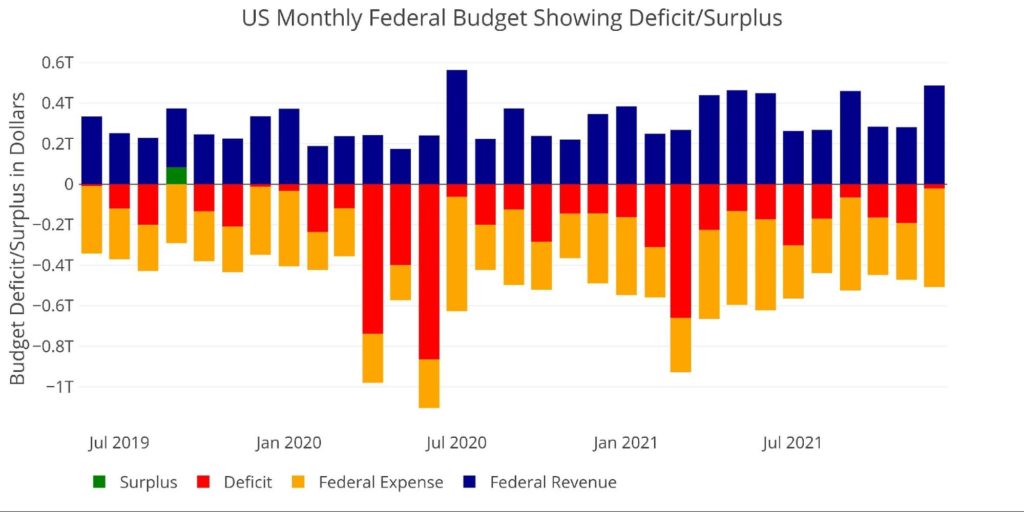
Figure: 1 Monthly Federal Budget
The Sankey diagram below provides a look at spending and revenue. Individual Taxes covered 50% of total spending in December. This compares with only covering 32.5% for the entire year (Figure 3). Health and Human Services (HHS) continue to be the biggest line item in the budget, representing 26.55% of total spending.
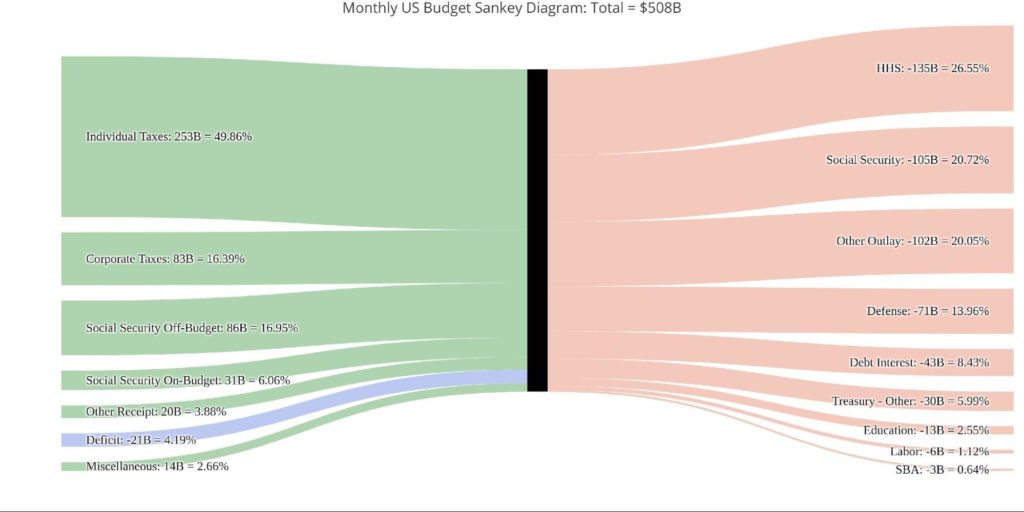
Figure: 2 Monthly Federal Budget Sankey
Comparing the monthly (above) to the yearly (below) shows a few trends to note.
- “Treasury – Other”, which represent stimulus payments, fell from 16.5% for the year down to 6% for December
- SBA (Small Business Association) also shrunk dramatically as PPP loans were phased out (5% to 0.6%)
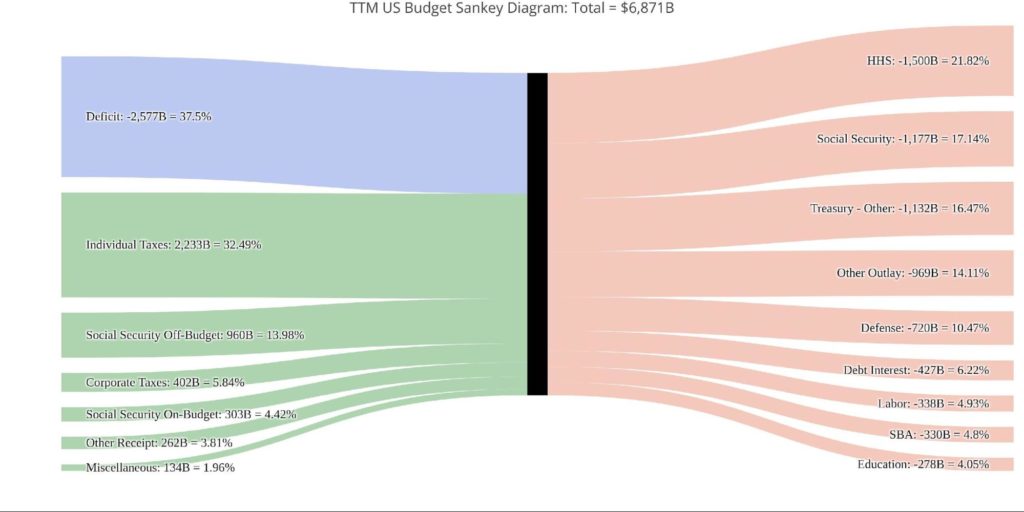
Figure: 3 TTM Federal Budget Sankey
Figure 4 below, expands on the revenue side of Figure 1 above. The light green bars represent Individual Tax Revenues. As shown, there has been a significant increase when compared to the period before Covid.
The Treasury does not offer much detail on the drivers of this increase, but it could be due to Capital Gains and Dividends from the roaring stock market. Some of it could be from the wage inflation showing up as well. A final reason could be the massive government spending that flooded the economy. The Treasury has to hope it’s wage inflation as the other two are both temporary.
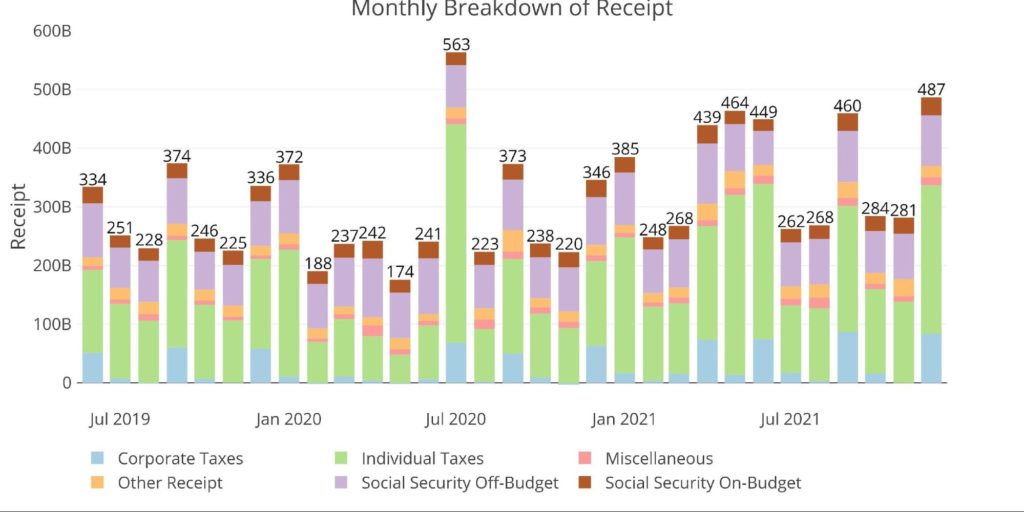
Figure: 4 Monthly Receipts
If the surge in tax revenues continues, it could create a better fiscal picture. As shown below, much of the spending this year came in the first half with stimulus payments. With stimulus having fallen off, if tax revenues stay elevated, it’s possible 2022 could be a “decent” year for the Treasury (decent probably means slightly below $1T… which is really not all that decent).
Of course, this assumes the economy does not go into recession as the Fed attempts to weakly fight inflation using slightly less accommodative policy.
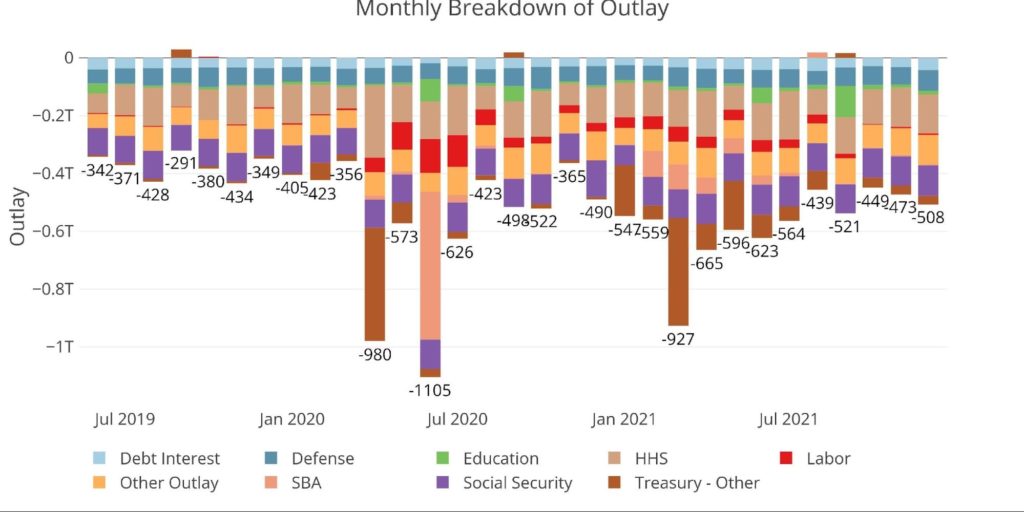
Figure: 5 Monthly Outlays
The table below goes deeper into the numbers of each category. The key takeaways from the charts and table:
Outlays
- Debt Interest is up 14% year over year even though interest rates are unchanged
- Debt Interest is even higher than 2019 when interest rates were between 1-2%
- How will higher interest rates impact the Federal Budget? See this analysis for a deeper dive.
- Spending on Education increased by $70B or 33%
- Labor and SBA spending both fell YoY as PPP and Unemployment spending fell
Receipts
- TTM Individual Taxes ($2.2T) are up nearly 42% YoY ($1.57T) and up 29% from the TTM ending 2019 ($1.7T)
- TTM Corporate Taxes ($401B) are up an incredible 86% YoY ($215B) and up 65% from the TTM ending 2019 ($242B)
- Corporate taxes are actually higher than where they were before the 2017 tax cuts
Total
- Total Receipts are up almost $900B in a single year!
- Despite a massive surge in receipts, the deficit is $1.5T larger than it was in the TTM ending Dec 2019

